- Data source
- Google Ads search volume for 7 new-construction searches and 2 resale searches (homes for sale, houses for sale) in the 50 largest Google Ads metro regions and all 50 states; Google search interest from 2019; households from the U.S. Census Bureau American Community Survey (2016-2020)
- Collected
- November 2026, covering October 2025 to September 2026 against October 2024 to September 2025; seasonality from 2023 to 2025
- Sample
- 50 metro areas and 50 states; 48 states with at least 100 searches a month ranked; 94,273 US new-construction searches a month
Key findings
- 1Las Vegas has the highest ratio of new-construction to resale searches of the 50 largest US metros, at 25.1 per 100, against 10.9 nationally.
- 2Orlando (23.8), Tampa (21.4) and Austin (20.7) follow, and four Texas metros, Austin, Houston, San Antonio and Dallas-Ft. Worth, all sit above 20 per 100.
- 3Honolulu has the lowest ratio at 4.5 per 100, followed by Fresno (5.5), Kansas City (5.6) and Boston (5.9).
- 4By state, Wyoming (14.01), South Carolina (12.44) and Texas (12.38) have the most new-construction searches per 10,000 households.
- 5US new-construction searches total 94,273 a month, down 32.3% on the year before and 18.2% below late 2022 to late 2023; only 3 states grew.
- 6March is the busiest month for new-construction searches, with 10.74% of the year, and December the quietest at 6.96%.
Summary
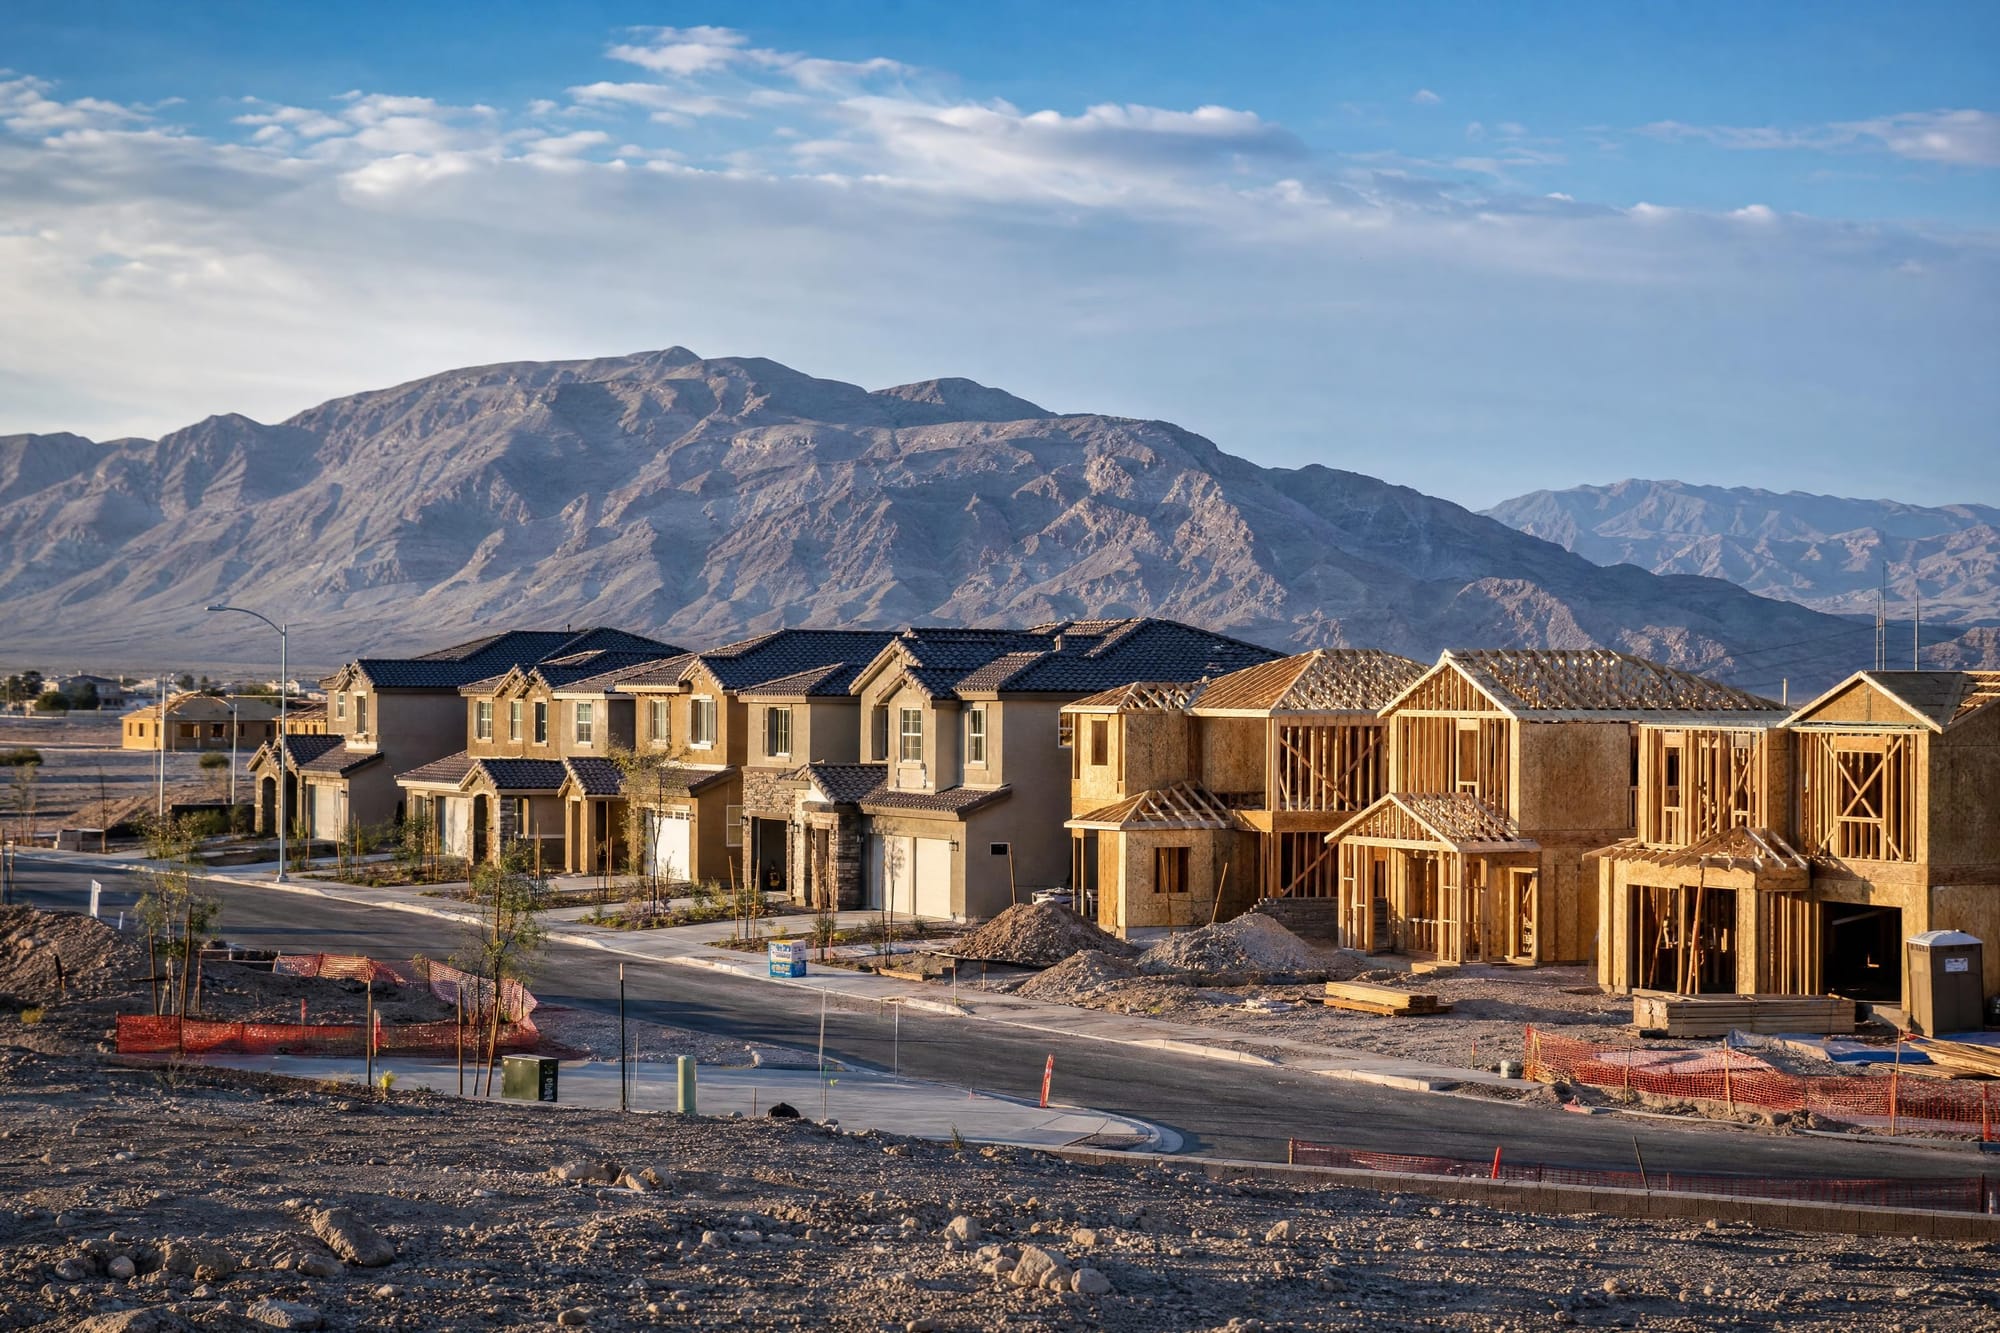
On the edge of a fast-growing metro, a builder has finished six homes on a new street. The model is furnished, the other five are empty, and the photos online show bare white rooms. Ten miles away, a buyer is deciding whether to look at resale homes in an older neighborhood or drive out to the new street. What she types into Google is a small vote for one or the other.
New and resale homes compete for the same buyers, but in very different proportions from one market to the next. Comparing new-construction searches with resale searches in the same metro shows how much of the buyer audience is looking at new builds. For builders, their marketing teams and the agents who sell new homes, that ratio is a direct measure of how large the new-construction audience is in each market.
It varies by a factor of five. Las Vegas has 25.1 new-construction searches for every 100 resale searches, Florida and Texas metros fill most of the top 10, and Honolulu has 4.5. Across the US the ratio is 10.9. Total new-construction searches are down 32.3% on the year before, so builders are competing for a smaller pool of search demand than in 2025.
What we measured
We collected Google Ads search volume for 7 searches buyers use to look for new homes, listed in the table below, from home builders near me and new construction homes to new construction townhomes. For the resale side we used the two most common buyer searches, homes for sale and houses for sale. Volumes were collected monthly for the US, each of the 50 states and the 50 largest Google Ads metro regions, which follow the traditional TV market areas and are named after their main cities. Close variants that Google returns with identical numbers count once.
The metro ratio is the average monthly new-construction searches in a metro divided by its average monthly resale searches, times 100, for October 2025 to September 2026. A ratio of 20 means 20 searches for new homes for every 100 searches for homes for sale. State rankings divide average monthly new-construction searches by the state's households in the U.S. Census Bureau American Community Survey (2016-2020). Growth compares the last 12 months with October 2024 to September 2025, and seasonality uses national volume for 2023 to 2025.
For the long-run view we used Google search interest, a term's share of all searches, for new construction homes, new homes for sale and homes for sale, monthly from January 2019 to October 2026 across the US. Each series was pulled twice and the two pulls averaged.
Limits: home builders near me is the largest single search and partly reflects people building on their own land, not only buyers of finished homes. Google rounds small volumes up, so states under 100 searches a month, Vermont and Alaska, are not ranked. Searches that Google cannot place within the US are assigned to the geographic center of the country, which can lift Kansas, 11th by state. The ratio measures search interest, not sales or permits.
Honolulu, Fresno and Kansas City have the lowest ratios
new-construction searches per 100 resale searches in Honolulu
At the other end, Honolulu has 4.5 new-construction searches per 100 resale searches, Fresno-Visalia 5.5, Kansas City 5.6 and Boston-Manchester 5.9. Chicago and Omaha are next at 6.5. In these metros the buyer audience is overwhelmingly looking at existing homes.
Honolulu has 4.5 new-build searches per 100 resale searches, under half the national 10.9.
Large coastal metros also sit low. Los Angeles has 10.2, New York 8.6 and San Francisco-Oakland-San Jose 7.4, even though they generate some of the biggest raw volumes. Dallas-Ft. Worth has the most new-construction searches of any metro, 4,572 a month, ahead of Los Angeles at 4,280 and New York at 3,975, but New York has 46,308 resale searches a month to Dallas-Ft. Worth's 22,700.
Wyoming, South Carolina and Texas lead per household
new-construction searches a month per 10,000 households in Texas
Relative to size, Wyoming has the most new-construction searching, 14.01 searches a month per 10,000 households, followed by South Carolina (12.44), Texas (12.38), North Carolina (11.83), Florida (11.72) and Nevada (11.53). The median across all 50 states is 6.11. Hawaii has the least at 2.32, then New Mexico (3.44), Rhode Island (3.48), Nebraska (3.83) and Massachusetts (3.88).
Average monthly Google Ads search volume for 7 new-construction searches, October 2025 to September 2026, per 10,000 households, with the ratio to resale searches. States under 100 searches a month are shown but not ranked.
| Wyoming | 14.01 | 327 | 20.3 | 105.2 | Yes |
| South Carolina | 12.44 | 2440 | 21.1 | -25.2 | Yes |
| Texas | 12.38 | 12267 | 17.8 | -26.9 | Yes |
| North Carolina | 11.83 | 4768 | 16.2 | -30.6 | Yes |
| Florida | 11.72 | 9293 | 18.7 | -25.5 | Yes |
| Nevada | 11.53 | 1303 | 21.4 | 0.8 | Yes |
| Georgia | 10.05 | 3850 | 13.9 | -28 | Yes |
| Utah | 9.93 | 997 | 12.8 | -34 | Yes |
| Idaho | 9.83 | 638 | 17 | -37.3 | Yes |
| Arizona | 9.79 | 2589 | 17.3 | -17.3 | Yes |
| Kansas | 9 | 1028 | 9.7 | 37.7 | Yes |
| Delaware | 8.65 | 321 | 11.3 | -41.5 | Yes |
| Virginia | 8.32 | 2649 | 11.6 | -43.1 | Yes |
| Pennsylvania | 7.71 | 3938 | 9.5 | -36.4 | Yes |
| North Dakota | 7.51 | 241 | 13.4 | -37.6 | Yes |
| Colorado | 7.44 | 1591 | 12.8 | -33.5 | Yes |
| Iowa | 7.4 | 943 | 9.5 | -20.9 | Yes |
| Alabama | 7.23 | 1366 | 11.5 | -34.2 | Yes |
| Maryland | 6.98 | 1558 | 9.9 | -36.4 | Yes |
| Indiana | 6.77 | 1763 | 8 | -41.6 | Yes |
| Washington | 6.74 | 1958 | 10.3 | -32.9 | Yes |
| Ohio | 6.73 | 3173 | 7.9 | -43 | Yes |
| New Jersey | 6.63 | 2170 | 9.7 | -22.7 | Yes |
| Tennessee | 6.6 | 1742 | 10.5 | -38.6 | Yes |
| California | 6.18 | 8100 | 8.6 | -20.1 | Yes |
| Wisconsin | 6.03 | 1433 | 6.9 | -43.7 | Yes |
| Louisiana | 5.77 | 1011 | 9.5 | -30.8 | Yes |
| Minnesota | 5.62 | 1241 | 6.2 | -45.2 | Yes |
| Michigan | 5.52 | 2198 | 6.9 | -37.4 | Yes |
| Illinois | 5.44 | 2658 | 6 | -41.6 | Yes |
| Oklahoma | 5.2 | 777 | 10.2 | -36.5 | Yes |
| South Dakota | 5.03 | 175 | 8.2 | -22.8 | Yes |
| Connecticut | 4.97 | 688 | 7.6 | -34.1 | Yes |
| Mississippi | 4.89 | 546 | 8.9 | -40.2 | Yes |
| Arkansas | 4.86 | 569 | 9.2 | -35.5 | Yes |
| West Virginia | 4.83 | 355 | 8 | -37.1 | Yes |
| Kentucky | 4.74 | 828 | 7.5 | -40 | Yes |
| New York | 4.57 | 3393 | 7 | -32.1 | Yes |
| Oregon | 4.57 | 751 | 7.8 | -40.3 | Yes |
| Missouri | 4.29 | 1047 | 6.3 | -48.7 | Yes |
| New Hampshire | 4.05 | 218 | 6.2 | -58.3 | Yes |
| Montana | 3.99 | 174 | 9.8 | -55.1 | Yes |
| Maine | 3.91 | 223 | 7 | -58 | Yes |
| Massachusetts | 3.88 | 1028 | 5.7 | -50 | Yes |
| Nebraska | 3.83 | 293 | 5.3 | -51 | Yes |
| Vermont | 3.58 | 94 | 7 | -61.3 | No, under 100 a month |
| Rhode Island | 3.48 | 144 | 5.9 | -43.8 | Yes |
| New Mexico | 3.44 | 273 | 6.5 | -46.9 | Yes |
| Alaska | 3.43 | 88 | 8 | -34 | No, under 100 a month |
| Hawaii | 2.32 | 108 | 4.5 | -72.4 | Yes |
Texas has the largest raw volume, 12,267 new-construction searches a month, ahead of Florida at 9,293 and California at 8,100. Against resale searches, Nevada has the highest state ratio at 21.4 per 100, then South Carolina at 21.1, Wyoming at 20.3 and Florida at 18.7. Hawaii is lowest at 4.5.
New-construction searches fell 32.3% in a year
change in US new-construction searches, year to September 2026
Across the US, the 7 searches add up to 94,273 a month, 32.3% fewer than in October 2024 to September 2025 and 18.2% fewer than in November 2022 to October 2023. Only 3 states saw growth in the last year: Wyoming (105.2%), Kansas (37.7%) and Nevada (0.8%). The steepest falls were in Hawaii (72.4%), New Hampshire (58.3%) and Maine (58%).
| Search | Searches a month | Change on prior year | Cost per click |
|---|---|---|---|
| home builders near me | 43,933 | -18.5% | $8.12 |
| new construction homes | 23,608 | -7% | $7.44 |
| new construction near me | 8,575 | -32.8% | $7.00 |
| new homes for sale | 7,817 | -74.8% | $4.98 |
| new build homes | 5,517 | +27.1% | $8.50 |
| new construction homes for sale | 3,075 | -69.3% | $5.18 |
| new construction townhomes | 1,748 | -11.5% | $4.14 |
Source: Google Ads search volume, US, October 2025 to September 2026 against October 2024 to September 2025
The decline is concentrated in the listing searches. New homes for sale fell 74.8% and new construction homes for sale 69.3%, while new construction homes fell only 7%. New build homes is the one phrasing that grew, up 27.1% to 5,517 searches a month. Clicks are expensive across the board: advertisers pay $4.14 to $8.50 per click, with new build homes and home builders near me at the top.
New-home searches peak in March, earlier than the buyer year
of the year's new-construction searches fall in March
Over 2023 to 2025, March carries 10.74% of the year's new-construction searches, the most of any month, followed by January at 9.66% and February at 9%. Searches drop to 7.97% in April and 7.09% in May, recover to 8.76% in August and reach their low of 6.96% in December.
January to March carry 29.4% of the year's new-construction searches.
The first quarter carries 29.4% of the year's searches. Buyers looking at new homes often need months before move-in, for a build to finish or a lot to be chosen, so they start early. Builders who refresh model photos and online listings in January meet that early audience.
New-home searching has fallen in step with resale since 2021
Google search interest shows that new and resale searching have followed the same path. Interest in new homes for sale averaged 2.8 in 2019, peaked at 4.6 in 2021, fell to 2 in 2024 and recovered to 3 in 2026, 65% of the 2021 peak. Homes for sale, on the same scale, went from 64.3 in 2019 to 86.3 in 2021 and 53.7 in 2026, 62% of its peak. New construction homes stays near 1 throughout on that scale, too small to read year to year.
| Year | New homes for sale | Homes for sale |
|---|---|---|
| 2019 | 2.8 | 64.3 |
| 2020 | 3.3 | 75.2 |
| 2021 | 4.6 | 86.3 |
| 2022 | 3.2 | 68.1 |
| 2023 | 2.7 | 60.3 |
| 2024 | 2 | 48.8 |
| 2025 | 2.1 | 49.3 |
| 2026 (to October) | 3 | 53.7 |
Search interest is a term's share of all Google searches, on a shared scale in one request. Source: Stagingmate analysis of Google search interest, US, January 2019 to October 2026; each series pulled twice and averaged
Because the two series have moved together, the gap between new and resale searching is more about place than about the market cycle. The metros with high ratios today are the ones with the most new homes to show, and that is where the competition for a new-build buyer's attention is greatest.
What this means for builders
In the high-ratio metros, a new build is a mainstream search, not a niche. In Las Vegas, Orlando, Tampa and the big Texas metros, buyers search for new construction homes at 20 or more for every 100 resale searches, so new listings compete directly with resale on the same screens. The listing photos need to hold up against furnished resale homes.
Empty spec homes are the weak point. A finished but unfurnished house photographs as bare rooms, and buyers comparing it with a lived-in resale home have to imagine the scale. We cover how builders use virtual staging for construction companies to show finished rooms furnished before anyone moves in, across a whole release of homes rather than one model.
Start early in the year. March is the busiest month for new-home searches and the first quarter carries 29.4% of the year, so photos and listings for spring releases should be live by January.
Austin has 20.7 new-construction searches per 100 resale searches, fourth of the 50 metros. Our virtual staging austin page shows new-construction rooms furnished in minutes for Austin listings.
Cite and download
Stagingmate Research. (2026). New Construction Homes: Las Vegas Leads With 25.1 per 100. Stagingmate. https://stagingmate.com/research/new-construction-search-demand-by-metro
Free to use and republish, as long as you credit Stagingmate Research with a link to this page. Need a local cut or a quote? Email support@stagingmate.com.
Frequently asked questions
Relative to resale, Las Vegas: it has 25.1 new-construction searches for every 100 searches for homes for sale, against 10.9 nationally. By raw volume, Dallas-Ft. Worth leads with 4,572 new-construction searches a month.
Per household, Wyoming leads at 14.01 searches a month per 10,000 households, followed by South Carolina (12.44) and Texas (12.38). Texas has the most searches overall, 12,267 a month.
Falling. US new-construction searches are down 32.3% in the year to September 2026, to 94,273 a month. Only Wyoming, Kansas and Nevada grew. New build homes was the one phrasing that rose, by 27.1%.
March, which carries 10.74% of the year's new-construction searches, followed by January and February. December is the quietest month at 6.96%.
Honolulu, with 4.5 new-construction searches per 100 resale searches, then Fresno-Visalia (5.5), Kansas City (5.6) and Boston-Manchester (5.9).