stagingmate
Research/Local news

Homes sell 2.4x faster in San Jose than in Cape Coral

Across the 100 largest US metros, the typical home in San Jose, CA sat for 36 days over the past year. In Cape Coral, FL it was 86 days, a gap of 50 days. Homes are sitting longer than a year ago in 83 of the 100 metros.

100 metros24 monthsRealtor.com data
Stagingmate Research
Published 2026-10-09
Method

Average of each metro's monthly median days on market for October 2025 to September 2026, compared with the 12 months before.

Sources
Realtor.com monthly listing inventory data (median days on market, listing prices, price cuts, active listings), 100 largest metro areas by households, October 2024 to September 2026
Limits

Realtor.com figures cover listings on Realtor.com and are medians for each month; a metro's median can move when the mix of homes listed changes.

Key findings

01The fastest metros: San Jose, CA (36 days), Rochester, NY (36 days) and Hartford, CT (37 days).
02The slowest: Cape Coral, FL (86 days), North Port, FL (83 days) and Miami, FL (83 days).
03The gap between fastest and slowest is 50 days.
04The median large metro took 55 days, up from 52 days a year earlier; 83 of 100 metros got slower.
36 days

median days on market in San Jose, CA, the fastest of the 100 largest metros.

86 days

in Cape Coral, FL, the slowest.

83/100

metros where homes take longer to sell than a year earlier.

Fastest and slowest

50 days

between the fastest (San Jose, CA) and slowest (Cape Coral, FL) of the 100 largest metros.

Fastest 10 metros: median days on market (Oct 2025 to Sep 2026)

San Jose, CA
36
Rochester, NY
36
Hartford, CT
37
Milwaukee, WI
38
Chicago, IL
40
San Francisco, CA
40
Washington, DC
41
Providence, RI
41
Worcester, MA
41
Allentown, PA
41
Source: Realtor.com; Stagingmate analysisstagingmate

Slowest 10 metros: median days on market

Cape Coral, FL
86
North Port, FL
83
Miami, FL
83
Lakeland, FL
81
Deltona, FL
80
New Orleans, LA
78
McAllen, TX
78
Port St. Lucie, FL
77
Orlando, FL
76
Urban Honolulu, HI
76
Source: Realtor.com; Stagingmate analysisstagingmate

All 100 metros

MetroDays on marketA year earlierChangeBuyer search YoY
San Jose, CA3634+5%
Rochester, NY3641−11%−9%
Hartford, CT3737+2%−17%
Milwaukee, WI3835+11%−4%
Chicago, IL4040+0%−3%
San Francisco, CA4042−5%−11%
Washington, DC4136+11%−22%
Providence, RI4138+7%−7%
Worcester, MA4134+21%
Allentown, PA4141+0%
Virginia Beach, VA4241+1%
Akron, OH4240+5%
New Haven, CT4244−4%
Boston, MA4238+11%−18%
Minneapolis, MN4242+1%−18%
Harrisburg, PA4242+2%0%
Baltimore, MD4238+11%−18%
Omaha, NE4344−3%−10%
Bridgeport, CT4345−4%
Cincinnati, OH4441+7%−9%
Toledo, OH4539+16%−8%
Richmond, VA4545−1%−6%
Grand Rapids, MI4543+5%−11%
Louisville/Jefferson County, KY4543+4%−16%
San Diego, CA4543+4%−9%
Detroit, MI4542+7%−13%
Dayton, OH4642+10%−12%
Philadelphia, PA4746+3%−12%
Cleveland, OH4746+2%−12%
Columbus, OH4743+9%−12%
Boise City, ID4748−1%−9%
Seattle, WA4743+10%−8%
Buffalo, NY4746+2%−3%
Spokane, WA4847+2%−8%
St. Louis, MO4947+5%−13%
Sacramento, CA5048+5%−9%
Columbia, SC5148+7%−15%
Stockton, CA5147+9%
Kansas City, MO5256−7%−8%
Little Rock, AR5252+0%−14%
Oxnard, CA5349+8%
Madison, WI5352+2%−14%
Portland, ME5354−1%−7%
Scranton, PA5352+2%−2%
Los Angeles, CA5451+6%−6%
Indianapolis, IN5449+9%−11%
Syracuse, NY5462−14%−4%
Houston, TX5451+6%−19%
Denver, CO5452+4%−18%
Wichita, KS5553+3%+2%
Bakersfield, CA5550+9%−17%
Oklahoma City, OK5650+10%−9%
Salt Lake City, UT5654+3%−15%
Charleston, SC5653+7%−13%
New York, NY5657−2%−13%
Kiryas Joel, NY5758−2%
Albany, NY5755+3%−11%
Fresno, CA5754+6%0%
Greensboro, NC5752+11%−12%
Raleigh, NC5854+6%−14%
Dallas, TX5855+5%−17%
Atlanta, GA5855+5%−5%
Winston, NC5852+12%
Durham, NC5853+9%
Las Vegas, NV5952+12%−14%
Tulsa, OK5956+5%−10%
Greenville, SC5955+9%−13%
Colorado Springs, CO5955+8%−10%
Charlotte, NC6053+12%−13%
Nashville, TN6056+6%−22%
Pittsburgh, PA6059+2%0%
Tucson, AZ6057+5%−7%
Birmingham, AL6260+3%−4%
Riverside, CA6260+3%
Phoenix, AZ6361+3%−16%
Knoxville, TN6357+9%−11%
Chattanooga, TN6359+7%−16%
Portland, OR6461+4%−11%
Des Moines, IA6564+3%−21%
Albuquerque, NM6763+6%−22%
Jacksonville, FL6869−1%−16%
Memphis, TN6864+6%−8%
San Antonio, TX6968+1%−18%
Palm Bay, FL7170+1%
Augusta, GA7166+8%−20%
Austin, TX7166+9%−10%
El Paso, TX7166+8%−15%
Jackson, MS7475−2%−18%
Tampa, FL7469+8%−15%
Baton Rouge, LA7578−3%−14%
Urban Honolulu, HI7671+6%−14%
Orlando, FL7672+6%−10%
Port St. Lucie, FL7777+0%
McAllen, TX7873+6%0%
New Orleans, LA7878−0%0%
Deltona, FL8081−1%
Lakeland, FL8178+4%
Miami, FL8379+5%−15%
North Port, FL8380+3%
Cape Coral, FL8685+1%

What this means for agents

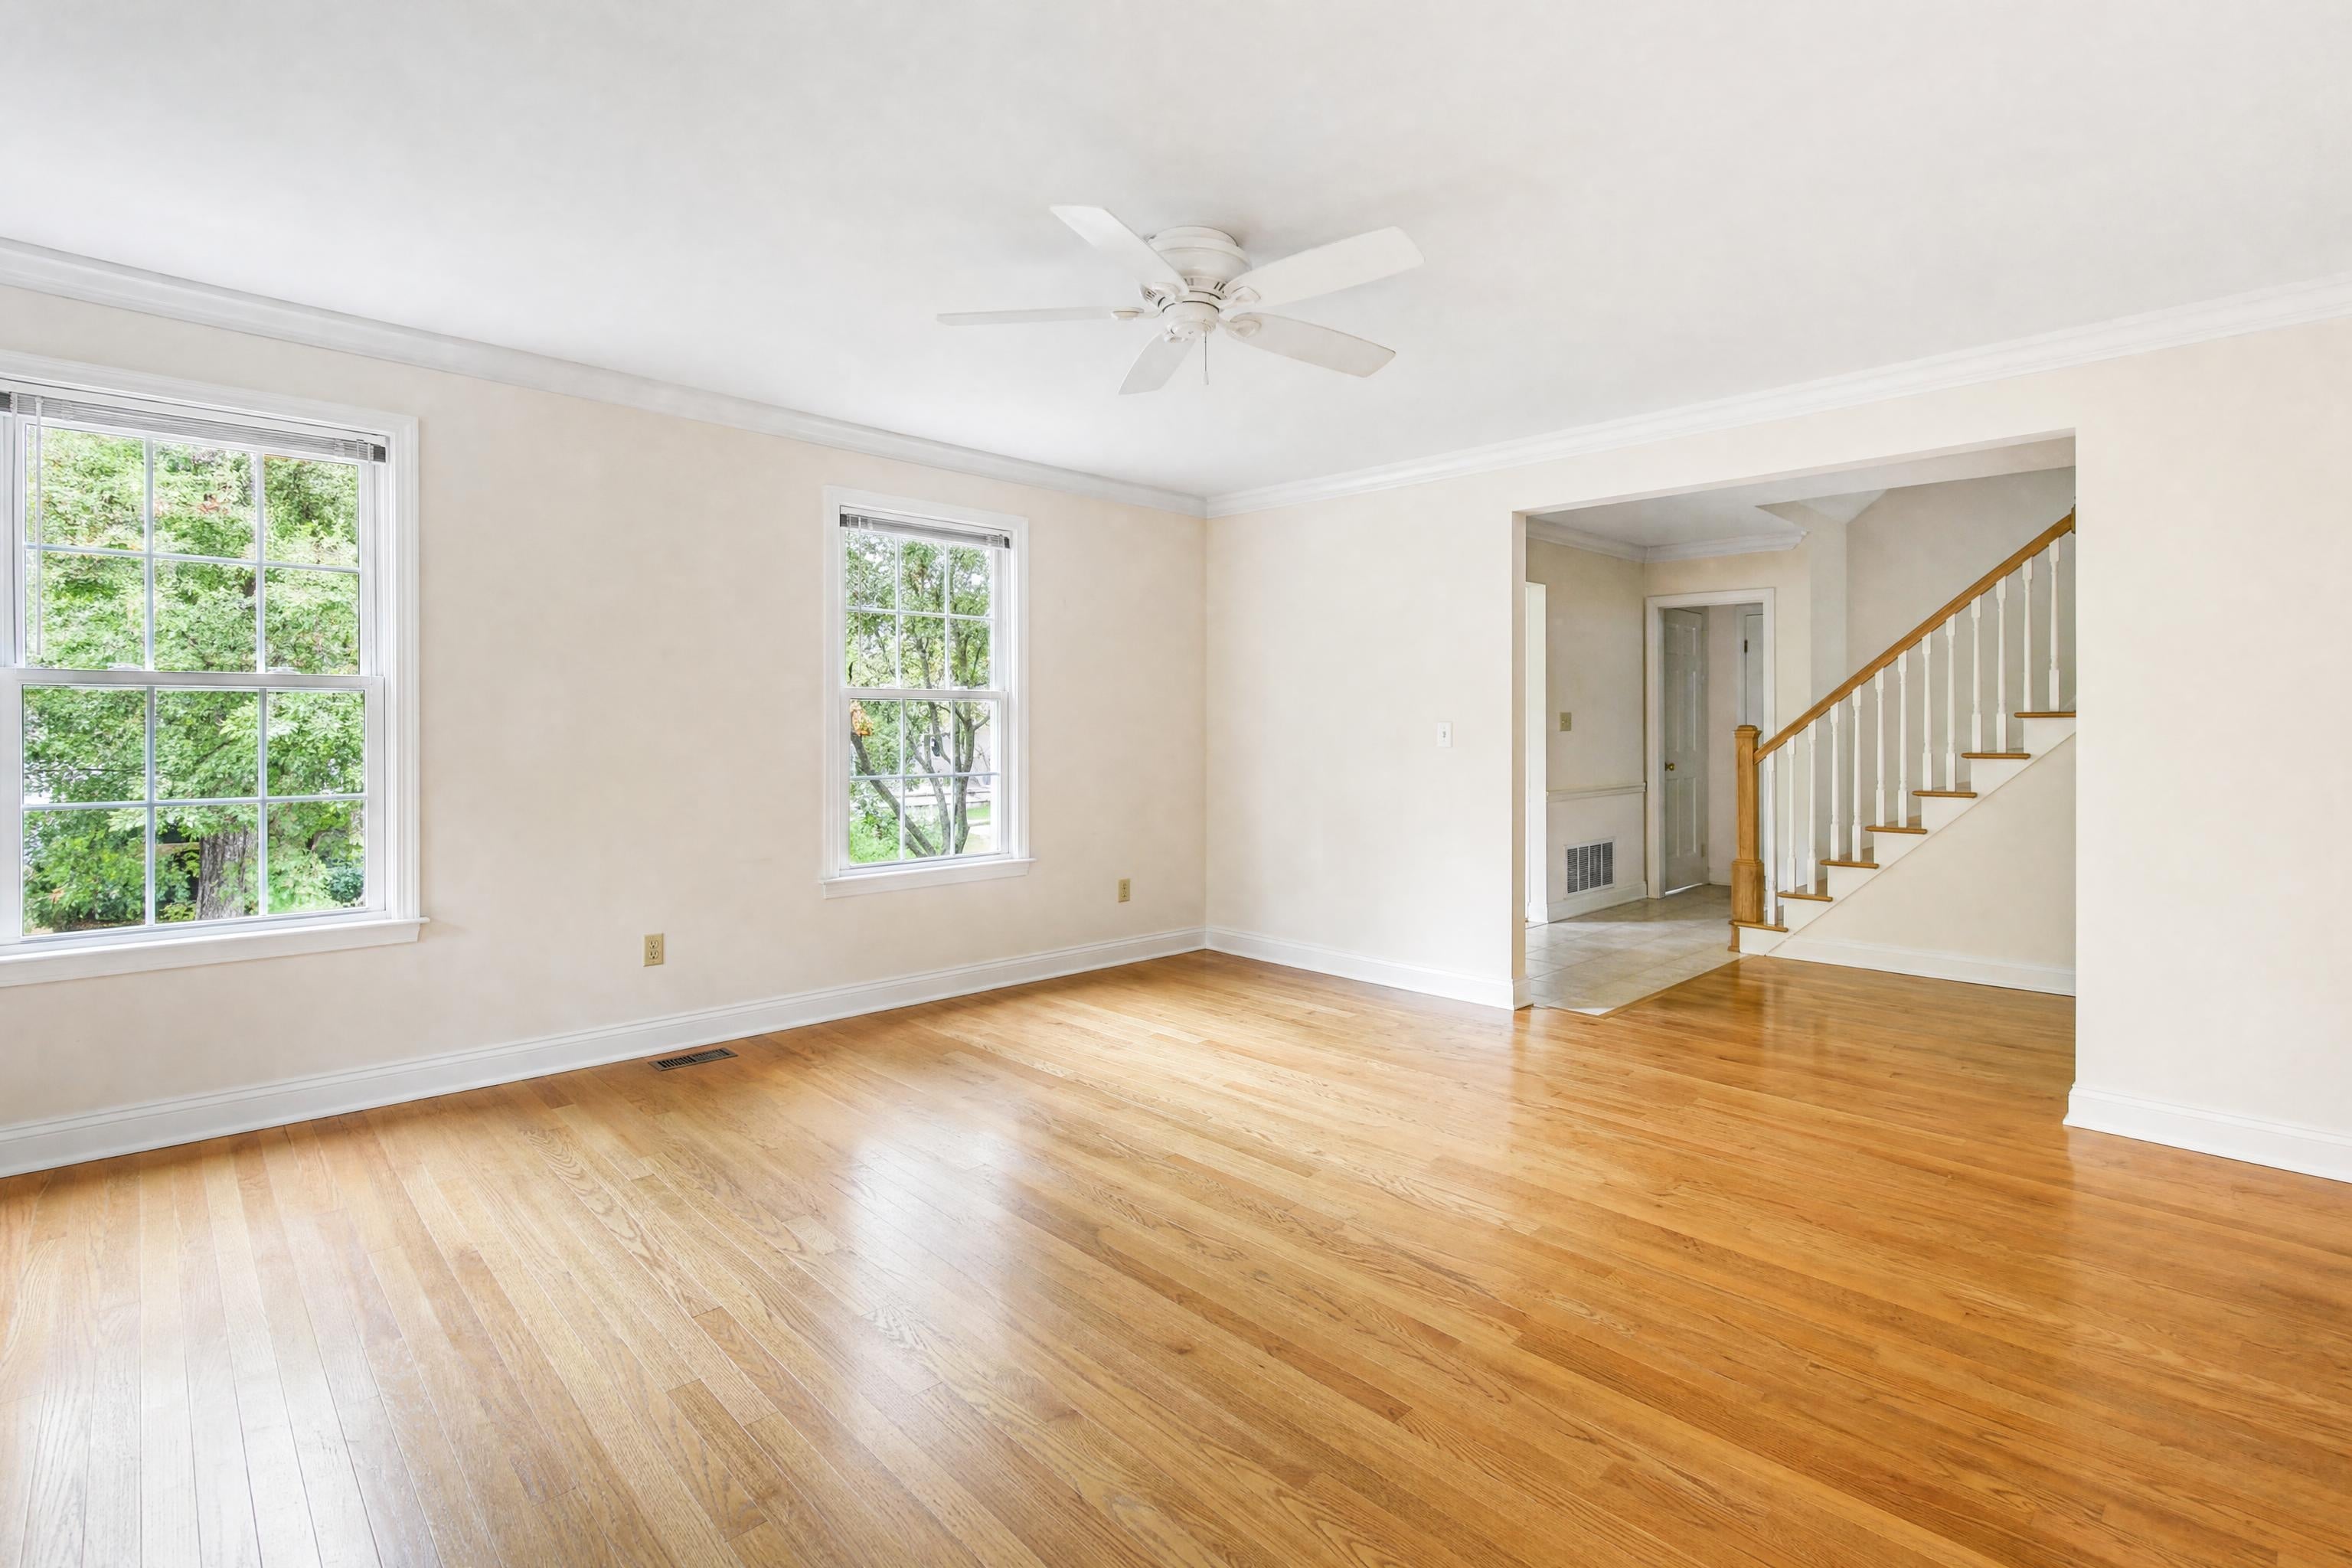
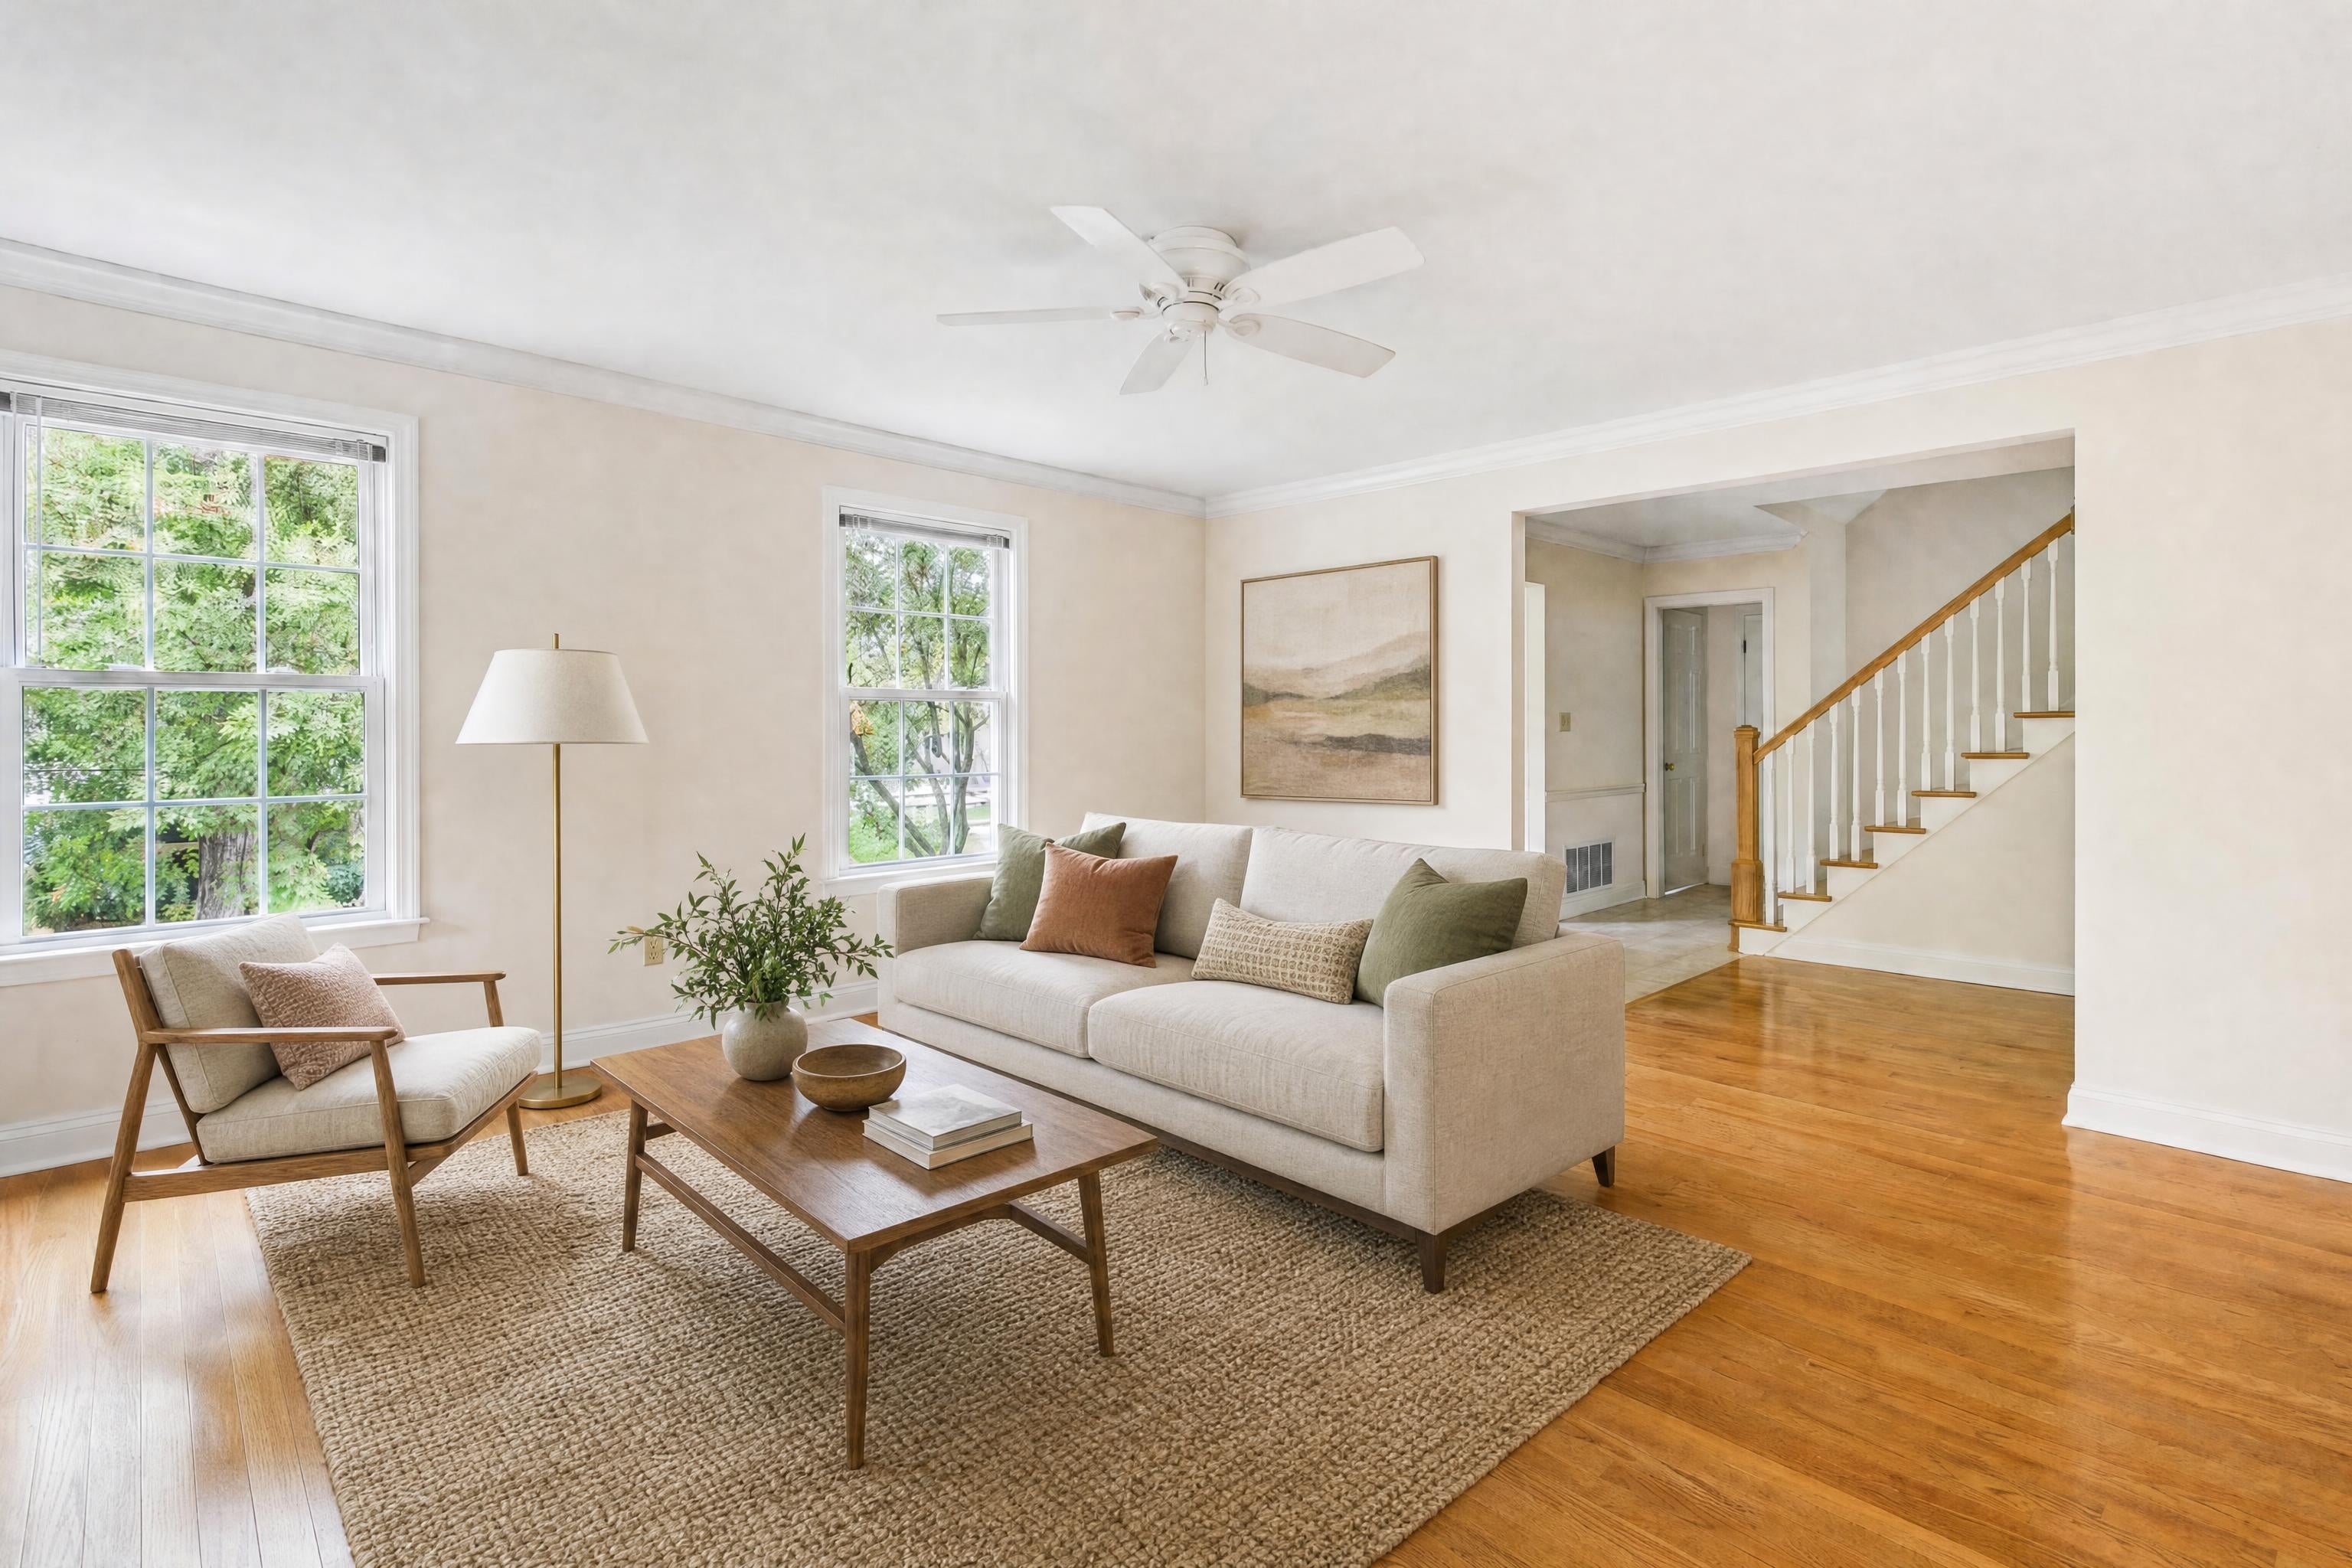
Stagingmate makes virtual staging for realtors simple: upload a photo, pick a style, and download an MLS-ready image in under a minute.

Stage a listing photo free
↔
BeforeAfter · Warm Modern
Cite this study

Stagingmate Research (2026). Homes sell 2.4x faster in San Jose than in Cape Coral. https://stagingmate.com/research/days-on-market-leaderboard-fastest-and-slowest-100-cities

Use our data

Free to use under CC BY 4.0 with a link to this page. For the full dataset or a local cut, email press@stagingmate.com.

About this study

Among the 100 largest metros, San Jose, CA, at a median of 36 days.

Related studies