stagingmate
Research/Housing desks

Connecticut has 1.41 agent listings for every home for sale, the most crowded market in the US

Nationally there are 0.51 Google Maps agent and brokerage listings for every active home listing. In Connecticut it's 1.41; in Louisiana, 0.27.

50 states527,988 agent listings1,037,489 active listings
Stagingmate Research
Published 2026-10-09
Method

Count of Google Maps listings in the real estate agency and real estate agent categories in each state, divided by the state's average monthly active listings on Realtor.com.

Sources
Google Maps business listings for real estate agents and brokerages, collected October 2026Realtor.com monthly listing inventory data (median days on market, listing prices, price cuts, active listings), all states, October 2025 to September 2026
Limits

Google Maps listings include teams, offices and individual agents, and not every licensed agent has one, so this is a measure of visible competition rather than a count of licensees. Active listings are a monthly average.

Key findings

01There are 0.51 agent and brokerage listings per active home listing nationally.
02The most crowded: Connecticut (1.41), Massachusetts (1.13) and California (1.1).
03The least crowded: Louisiana (0.27), Mississippi (0.28) and Arkansas (0.28).
1.41

agent and brokerage listings per home for sale in Connecticut.

0.51

nationally.

0.27

in Louisiana, the least crowded.

Agent listings per home for sale, by state

Google Maps agent and brokerage listings divided by average active listings, Oct 2025 to Sep 2026.

CT1
MA1
CA1
RI1
IL1
NJ1
NH1
MD1
VA1
NY1
WA1
PA1
MN1
DE1
OH1
NV1
MI1
AK1
CO1
ID1
OR0
IN0
KS0
WI0
AZ0
NE0
MT0
WY0
KY0
MO0
ND0
NM0
UT0
NC0
SD0
FL0
HI0
GA0
AL0
SC0
TN0
ME0
IA0
VT0
TX0
OK0
WV0
AR0
MS0
LA0
0.27
1.41

All 50 states

Click a column to sort
Connecticut1.4163354499
Massachusetts1.131175910372
California1.17266965866
Rhode Island114501450
Illinois0.951846019527
New Jersey0.91546017110
New Hampshire0.8323372825
Maryland0.791145514483
Virginia0.791659220945
New York0.712521135641
Washington0.691526022235
Pennsylvania0.651538823824
Minnesota0.63886014156
Delaware0.6118923103
Ohio0.611231220053
Nevada0.59730412391
Michigan0.581318822925
Alaska0.558891625
Colorado0.531457527725
Idaho0.5340817716
Oregon0.49757115511
Indiana0.48774616177
Kansas0.4835477377
Wisconsin0.48612712771
Arizona0.471385929316
Nebraska0.4523735308
Montana0.4321995149
Wyoming0.429812333
Kentucky0.41487311883
Missouri0.41763018815
North Dakota0.417681893
New Mexico0.425986511
Utah0.4524713204
North Carolina0.391656742885
South Dakota0.3912013110
Florida0.3859412156757
Hawaii0.3823706285
Georgia0.371800348137
Alabama0.36761020879
South Carolina0.35937226954
Tennessee0.351142333093
Maine0.3315954803
Iowa0.32336410619
Vermont0.327062201
Texas0.339145129328
Oklahoma0.29456015640
West Virginia0.2911503903
Arkansas0.28372213411
Mississippi0.2824628888
Louisiana0.27433015877

The most crowded markets

Agent listings per home for sale, top 10 states

Connecticut
1.41
Massachusetts
1.13
California
1.1
Rhode Island
1
Illinois
0.95
New Jersey
0.9
New Hampshire
0.83
Maryland
0.79
Virginia
0.79
New York
0.71
Source: Google Maps and Realtor.com; Stagingmate analysisstagingmate

What this means for agents

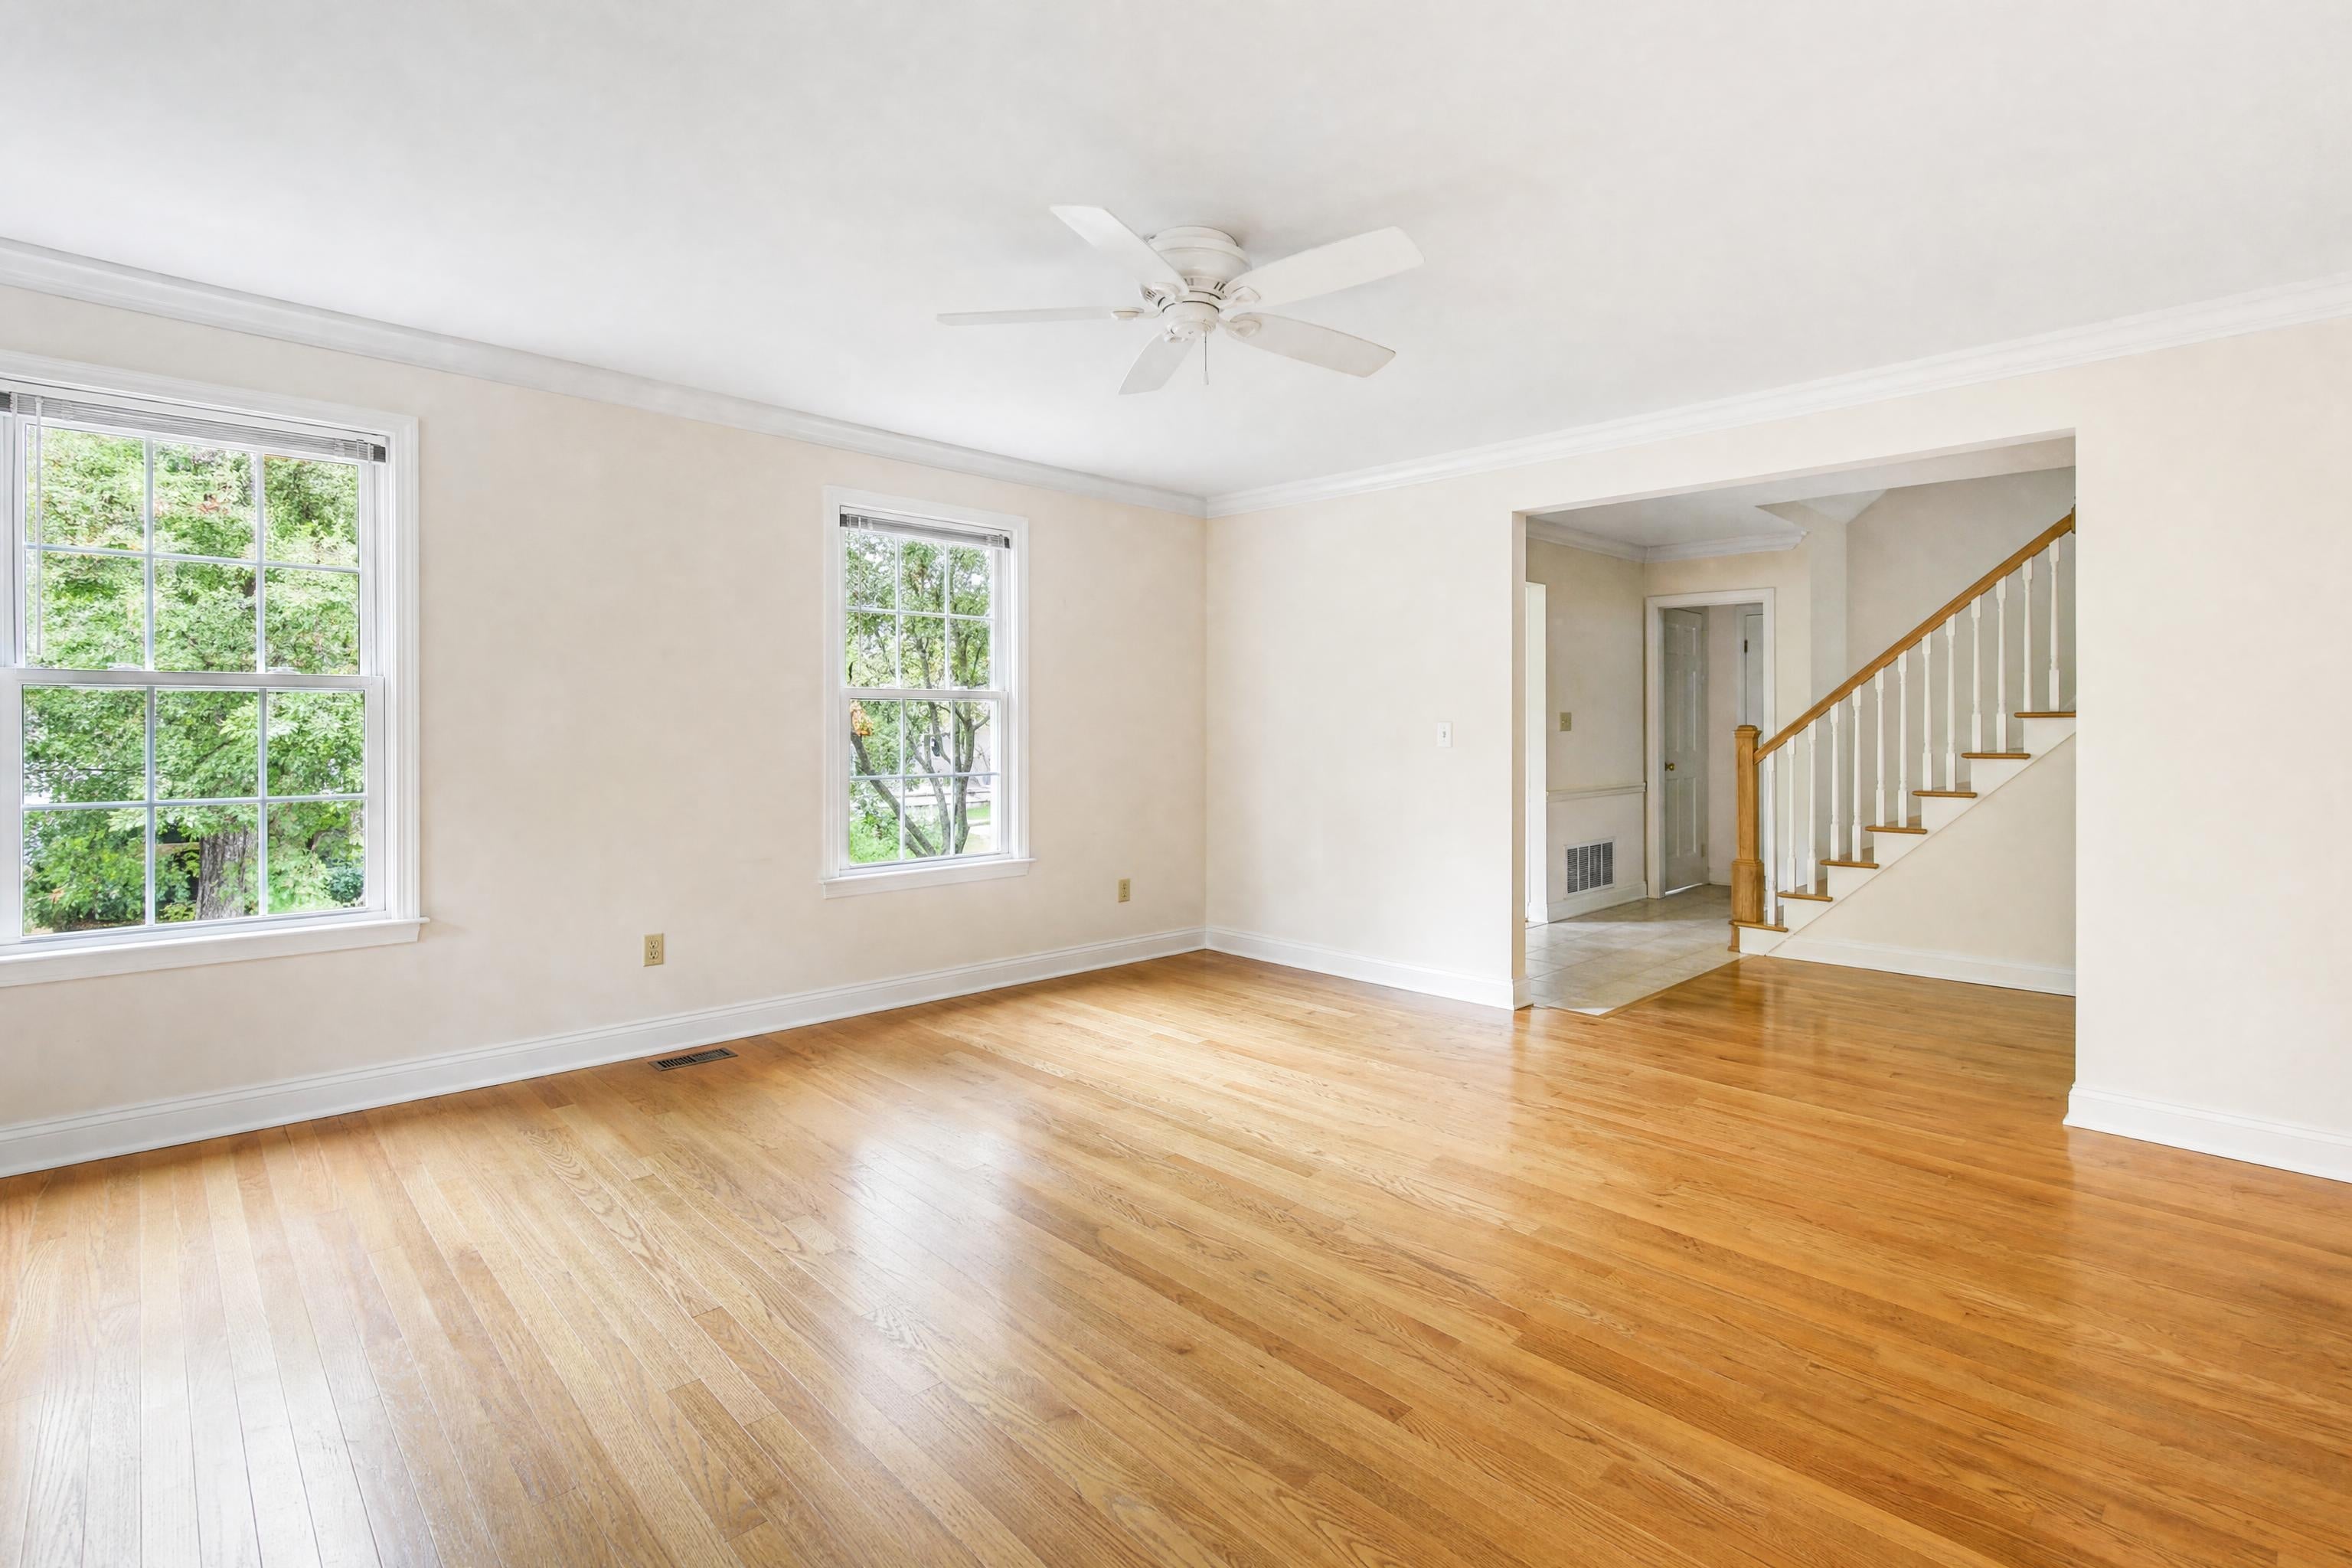
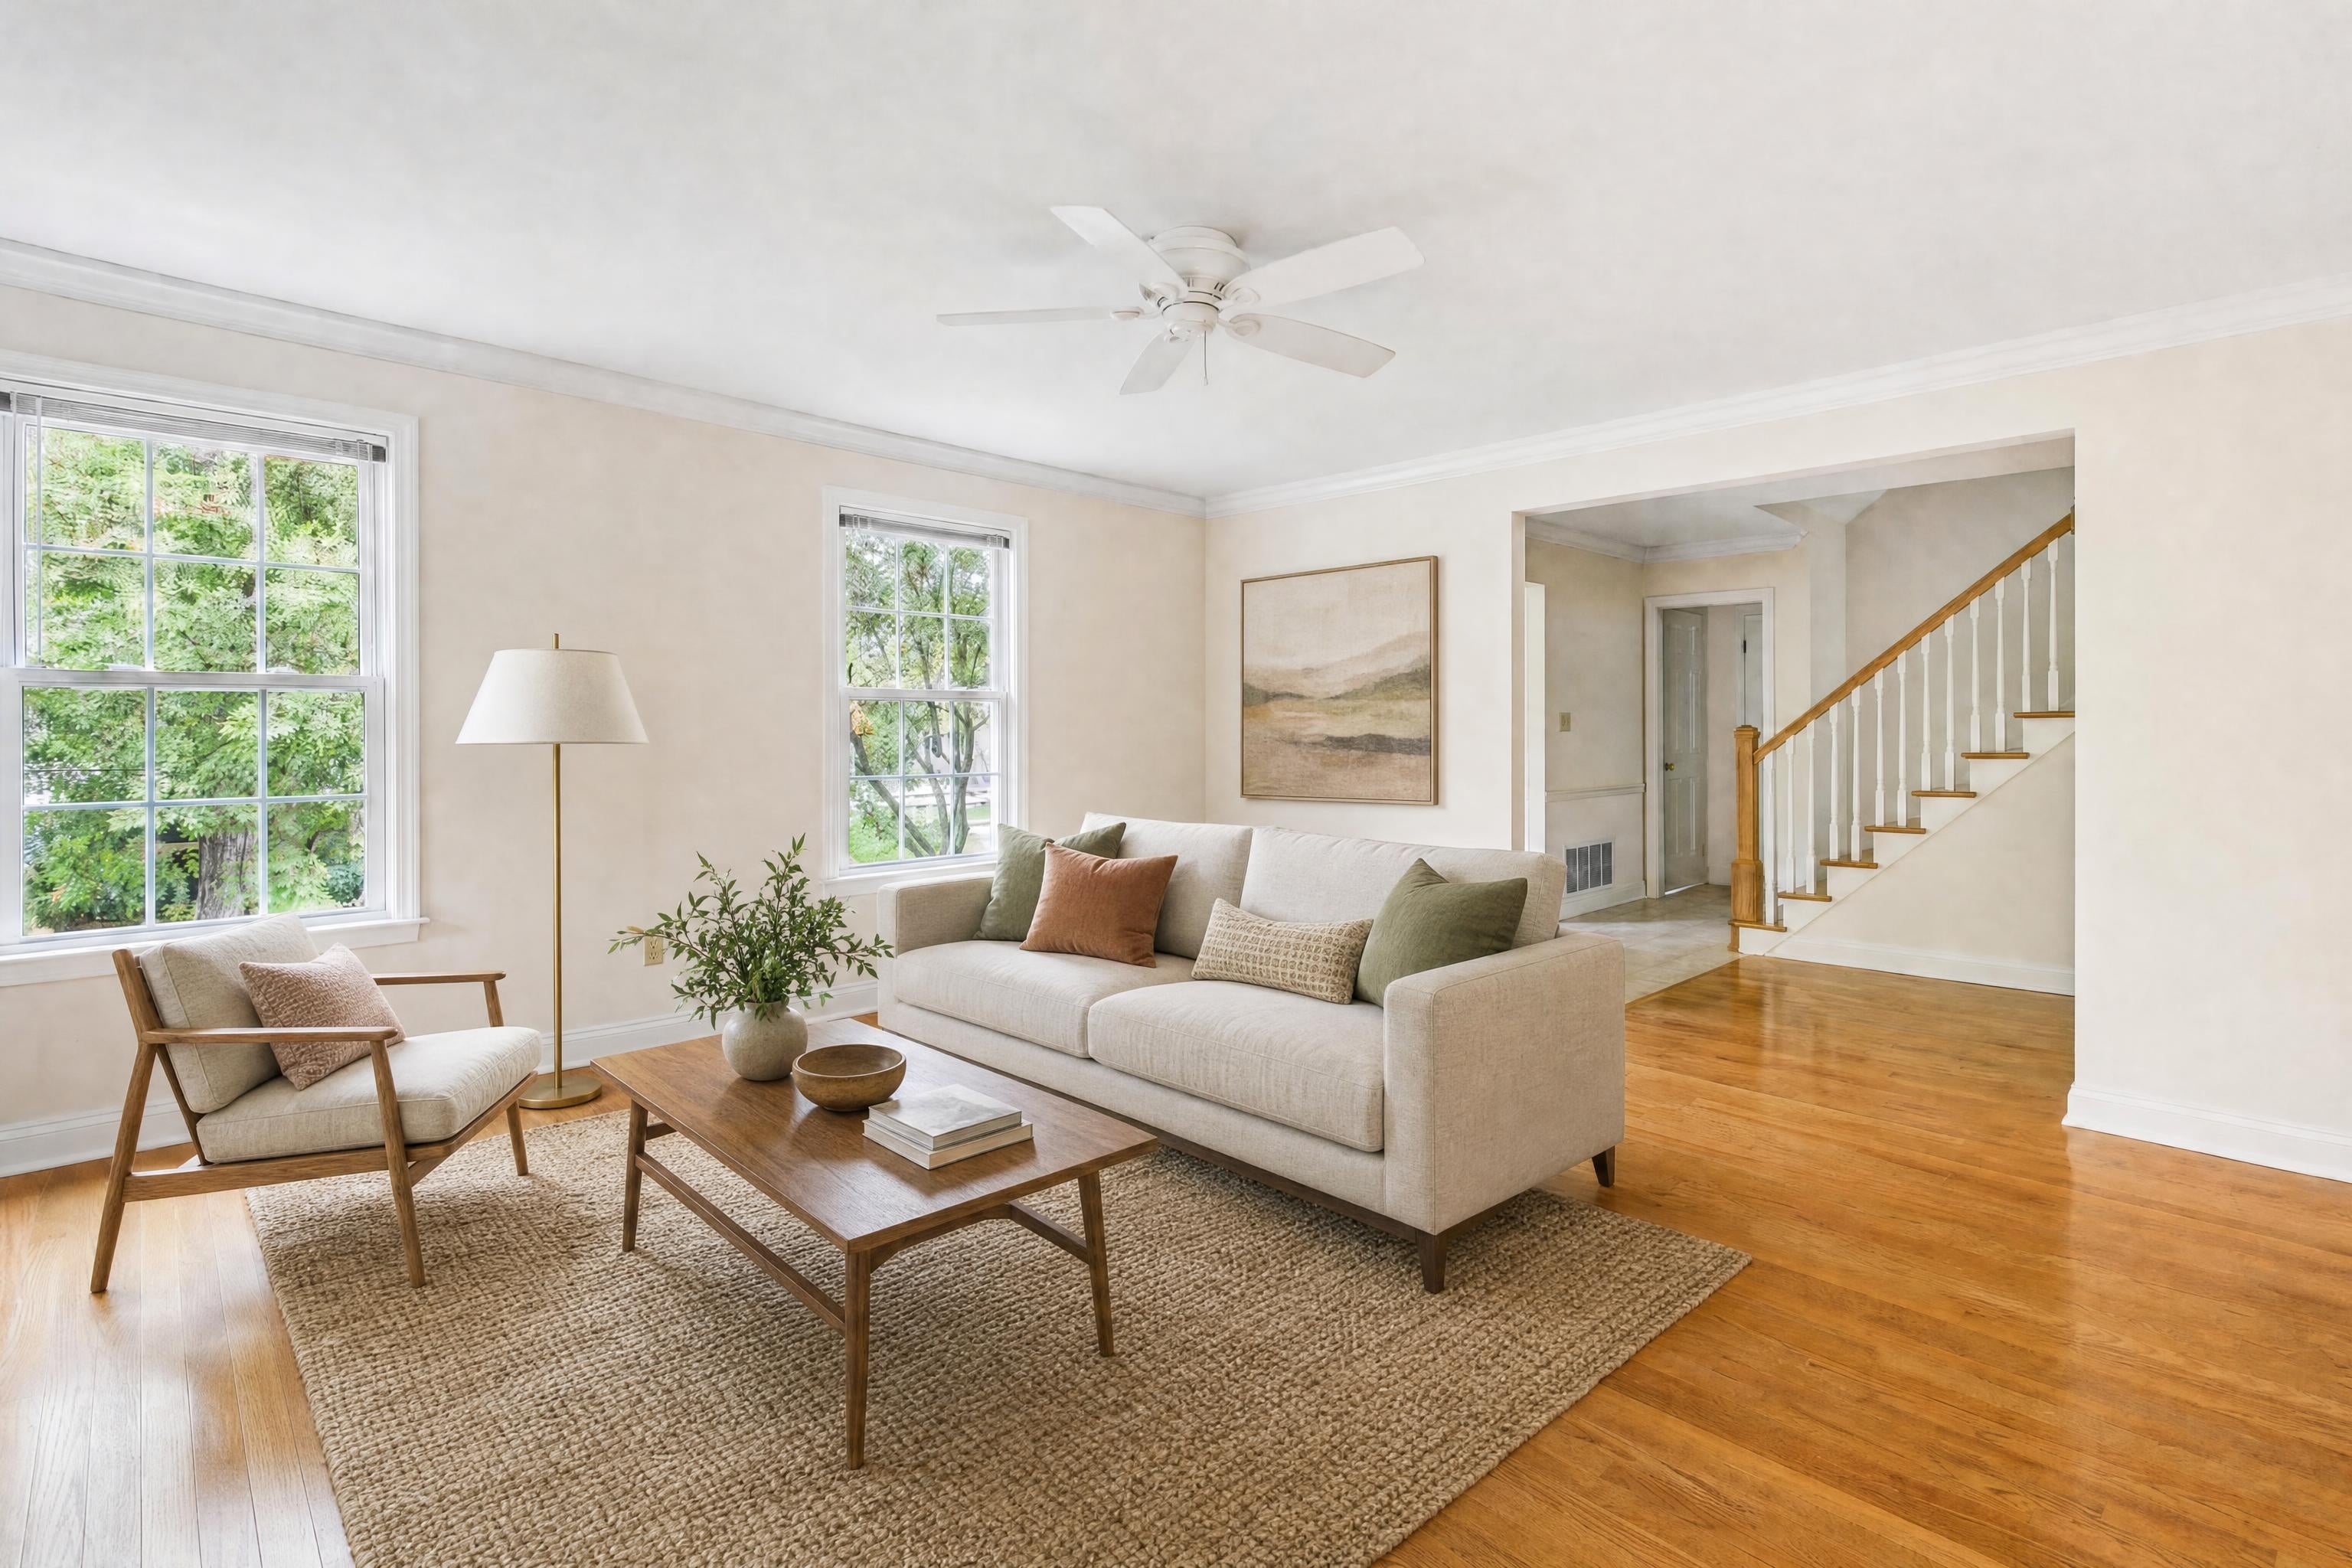
Stagingmate makes virtual staging for realtors simple: upload a photo, pick a style, and download an MLS-ready image in under a minute.

Stage a listing photo free
↔
BeforeAfter · Warm Modern
Cite this study

Stagingmate Research (2026). Connecticut has 1.41 agent listings for every home for sale, the most crowded market in the US. https://stagingmate.com/research/how-many-real-estate-agents-are-there-per-listing

Use our data

Free to use under CC BY 4.0 with a link to this page. For the full dataset or a local cut, email press@stagingmate.com.

About this study

About 0.51 agent and brokerage listings per active home listing nationally, from 0.27 in Louisiana to 1.41 in Connecticut.

Related studies