stagingmate
Research/Housing / legal press

Searches for buyer agreements are up 105% since the NAR settlement

Before the NAR settlement, Americans searched for buyer agency or buyer broker agreements about 2,376 times a month. In the latest 12 months, with written buyer agreements now required, it's 4,867. Searches about commissions spiked 14.8x in March 2024, then settled 20% below where they started.

50 states47 monthsBefore vs after Aug 2024
Stagingmate Research
Published 2026-10-09
Method

Monthly Google search volumes summed per period. State figures are per 10,000 homes-for-sale searches in the same state and period, to adjust for market size. The weekly timing of the commission spike comes from Google Trends, pulled twice and averaged.

Sources
Google monthly search volume estimates, October 2022 to August 2026Google Trends search interest
Limits

Google reports rounded monthly search volumes, and very small volumes show as 10 or nothing, so small states and rare queries are noisy. Google may group close variants of a query. Search volume measures interest, not transactions. Searches come from agents as well as consumers. This shows interest in the new rules, not how commissions changed.

Key findings

01US searches for buyer agency and buyer broker agreements rose 105%, from 2,376 a month before the settlement to 4,867 in Sep 2025–Aug 2026.
02Agreement searches peaked in August 2024 at 18,700, the month the new rules took effect.
03Commission and fee searches hit 232,500 in March 2024, 14.8x the pre-settlement average. In Google Trends, "realtor commission" peaked the week of 2024-03-17, at 6.1x its 2023 weekly average.
04Commission searches have since fallen 20% below the pre-settlement level, and "nar settlement" searches are down to 1,175 a month from 165,000 at the peak.
05Agreement searches rose fastest in Indiana (+393%), Ohio (+392%) and New Jersey (+355%).
+105%

change in US searches for buyer agency and buyer broker agreements, Oct 2022–Jul 2023 vs Sep 2025–Aug 2026.

14.8x

commission and fee searches in March 2024, vs the pre-settlement monthly average.

49/30

states with enough search volume where buyer-agreement searches rose.

Buyer-agreement searches by state

Buyer agency and buyer broker agreement searches per 10,000 homes-for-sale searches, Sep 2025 to Aug 2026. 30 states with enough volume to measure; the rest are left blank.

NM134
AR101
OK99
AZ89
FL87
TX83
LA75
NJ72
MO66
VA63
GA61
IN60
OR60
WA60
IA57
KY55
IL55
WI54
TN54
CO54
SC52
NY51
CA48
MD47
OH47
NC41
MA39
PA36
MI32
MN29
29.1
133.5

All 30 states

Click a column to sort
New Mexico133.530.6336506.3259
Arkansas101.231.6221439.4221.3
Oklahoma99.425.9283446.5173.5
Arizona88.927.3226511.9140.7
Florida86.626.8223501.5124.2
Texas82.640.4104422.2116.5
Louisiana7527.9169425.2158
New Jersey71.715.8355641.2174.4
Missouri6623.8177374.2132.1
Virginia62.628.2122519.1143.3
Georgia61.233.384606.4201.4
Indiana6012.2393265.2101.1
Oregon59.717.1248459.6142.7
Washington59.623.2158493.2150.9
Iowa5717.6224364113.2
Kentucky55.217.8211352.5162.7
Illinois55.115267344.195.1
Wisconsin54.328.194284.198.6
Tennessee53.821.4151438.6150
Colorado53.625.5110706206.9
South Carolina52.130.571718.4359
New York50.928.480442.5133.3
California48.418.8158457.5102.9
Maryland46.930.355500.2162.9
Ohio46.89.5392278.595.2
North Carolina41.315.9159665.6360.2
Massachusetts38.716.4136519.7135.3
Pennsylvania35.514.1152360.8109.6
Michigan32.111.4181303.690.8
Minnesota29.113.9110356.1105.5

From commission shock to paperwork

14.8x

commission and fee searches in March 2024 compared with a normal month before the settlement.

The settlement news broke in March 2024, and searches about commissions jumped overnight. When the new rules took effect in August 2024, attention moved to the buyer agreements every MLS buyer now has to sign before touring homes. That interest has stayed roughly double its old level.

US searches for buyer agreements, monthly average by quarter

Q4 2022
1953
Q1 2023
2620
Q2 2023
2573
Q3 2023
2320
Q4 2023
2473
Q1 2024
4267
Q2 2024
5067
Q3 2024
12667
Q4 2024
7200
Q1 2025
8767
Q2 2025
7467
Q3 2025
6267
Q4 2025
4267
Q1 2026
5267
Q2 2026
4933
Source: Google search volume data; Stagingmate analysisstagingmate

Where buyer agreements are searched most

StateAgreement searches per 10k home searchesChange since 2022–23
New Mexico133.5+336%
Arkansas101.2+221%
Oklahoma99.4+283%
Arizona88.9+226%
Florida86.6+223%
Texas82.6+104%
Louisiana75+169%
New Jersey71.7+355%
Missouri66+177%
Virginia62.6+122%

What this means for agents

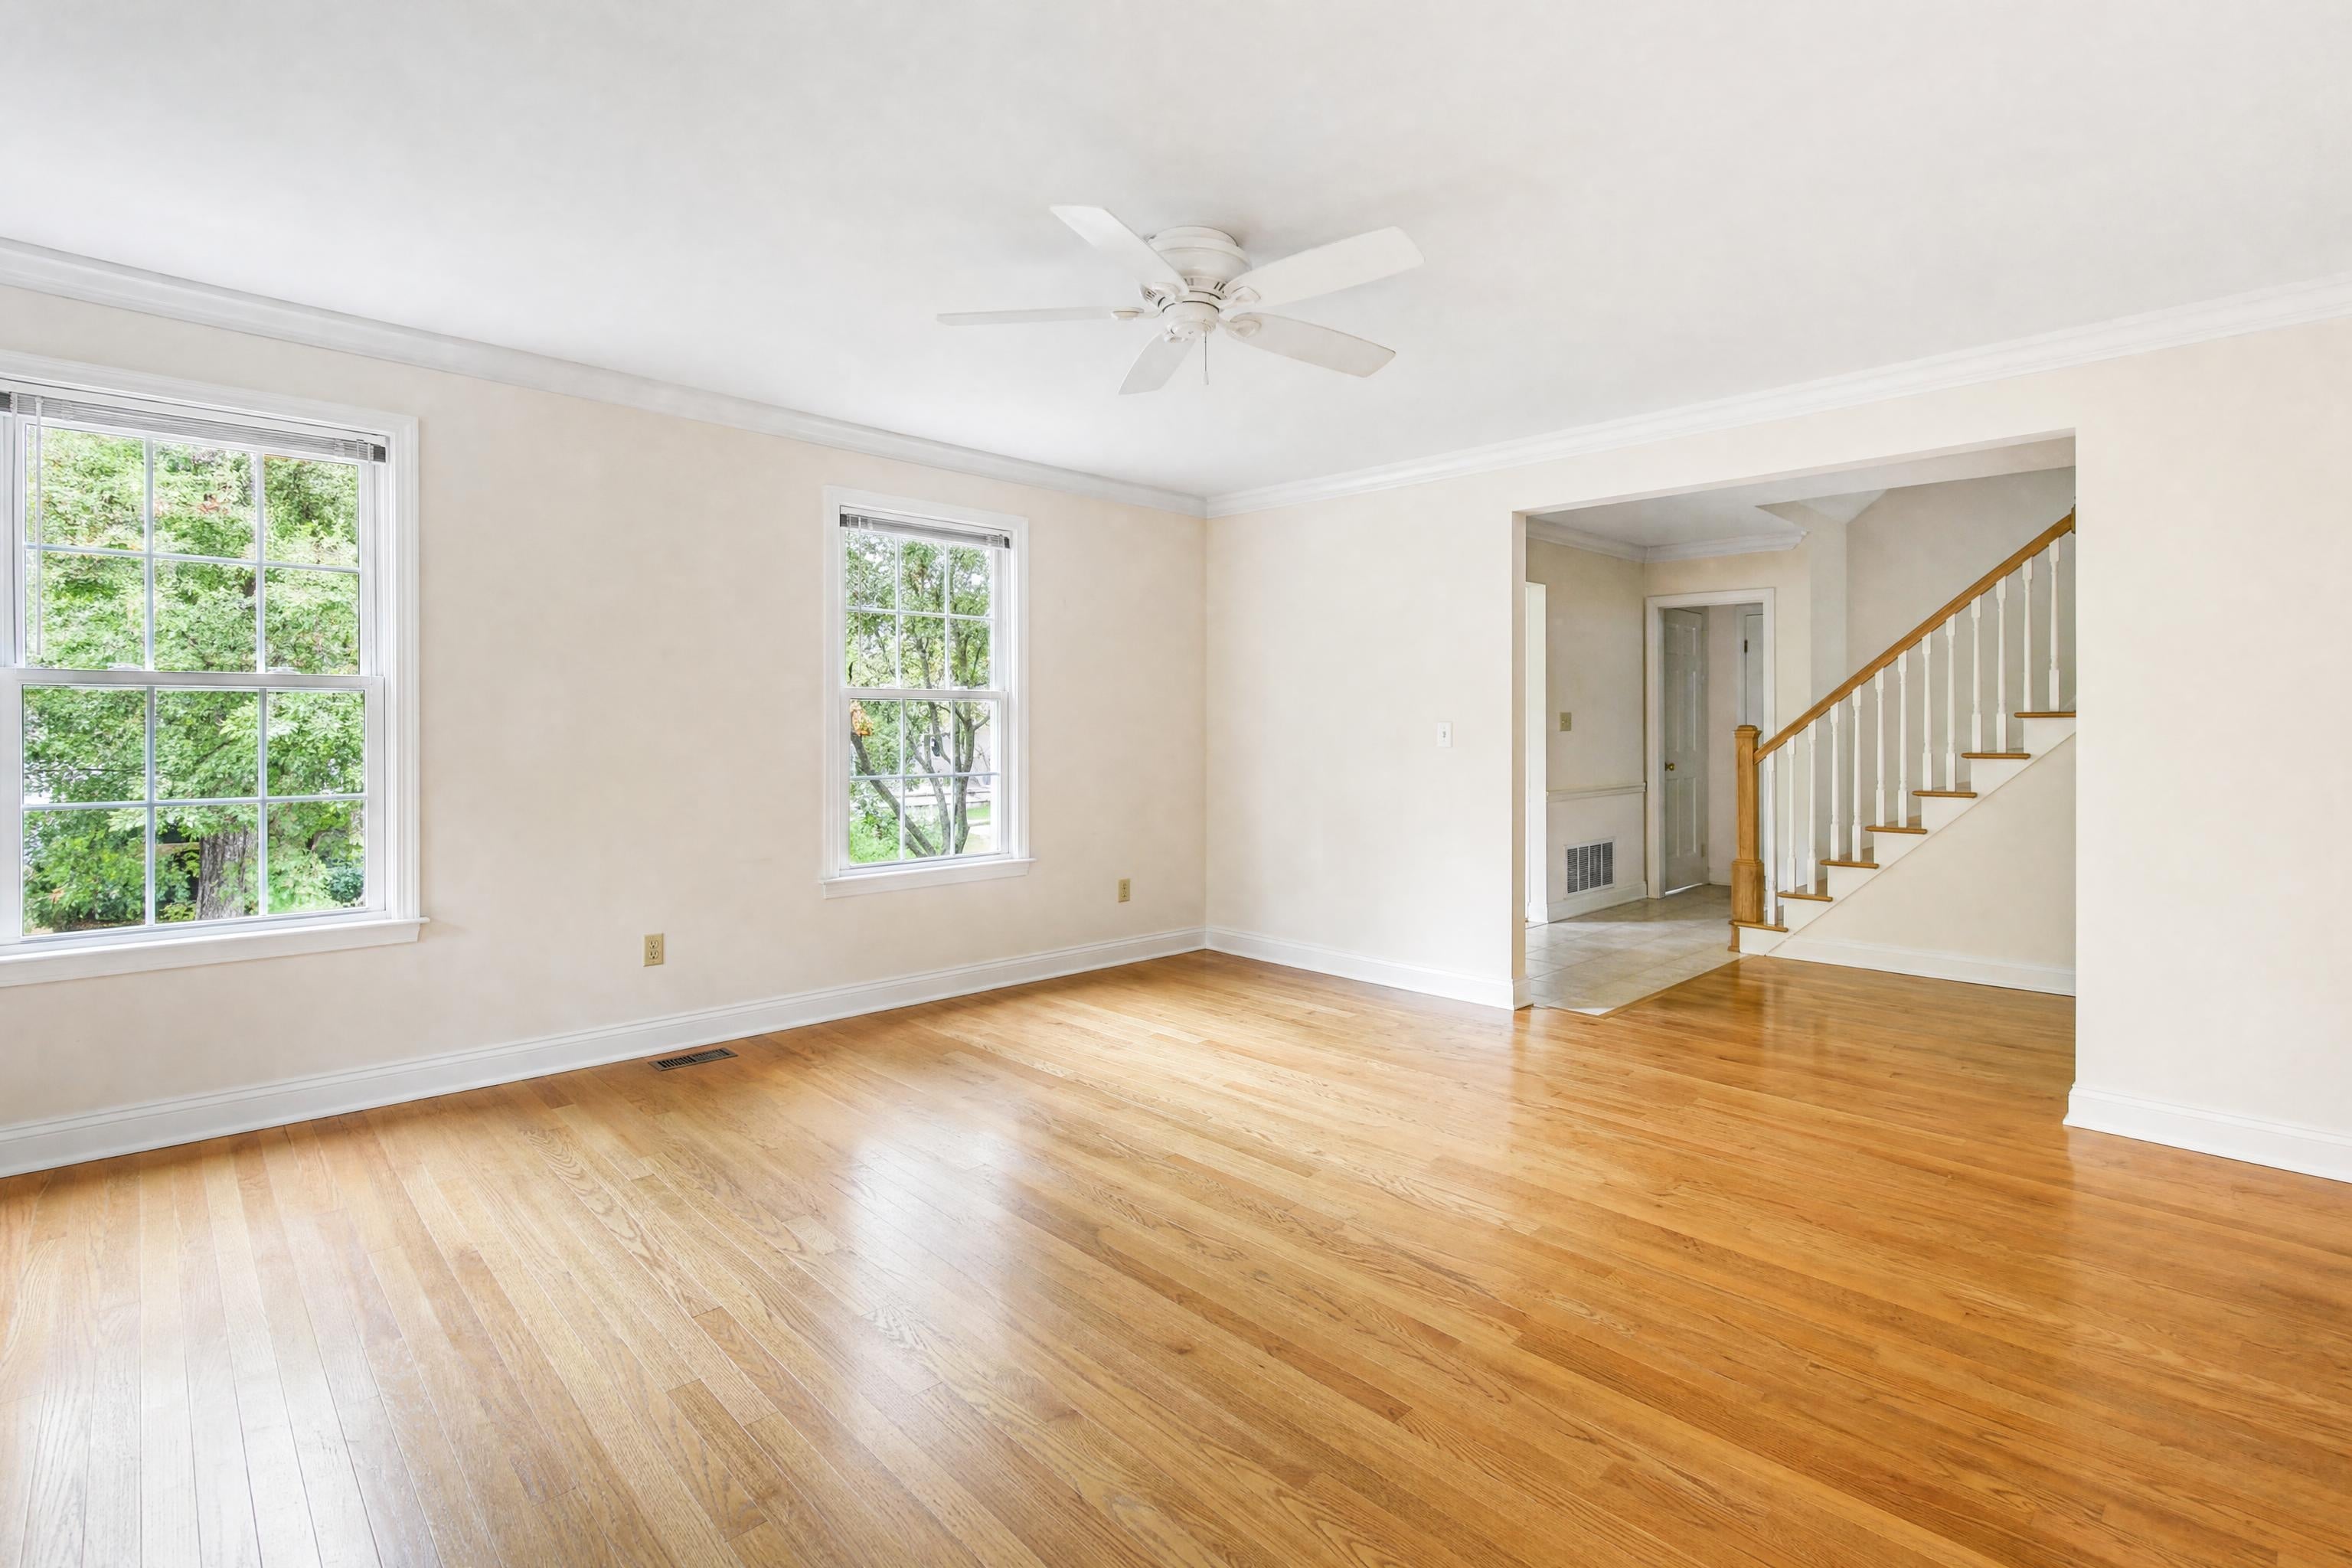
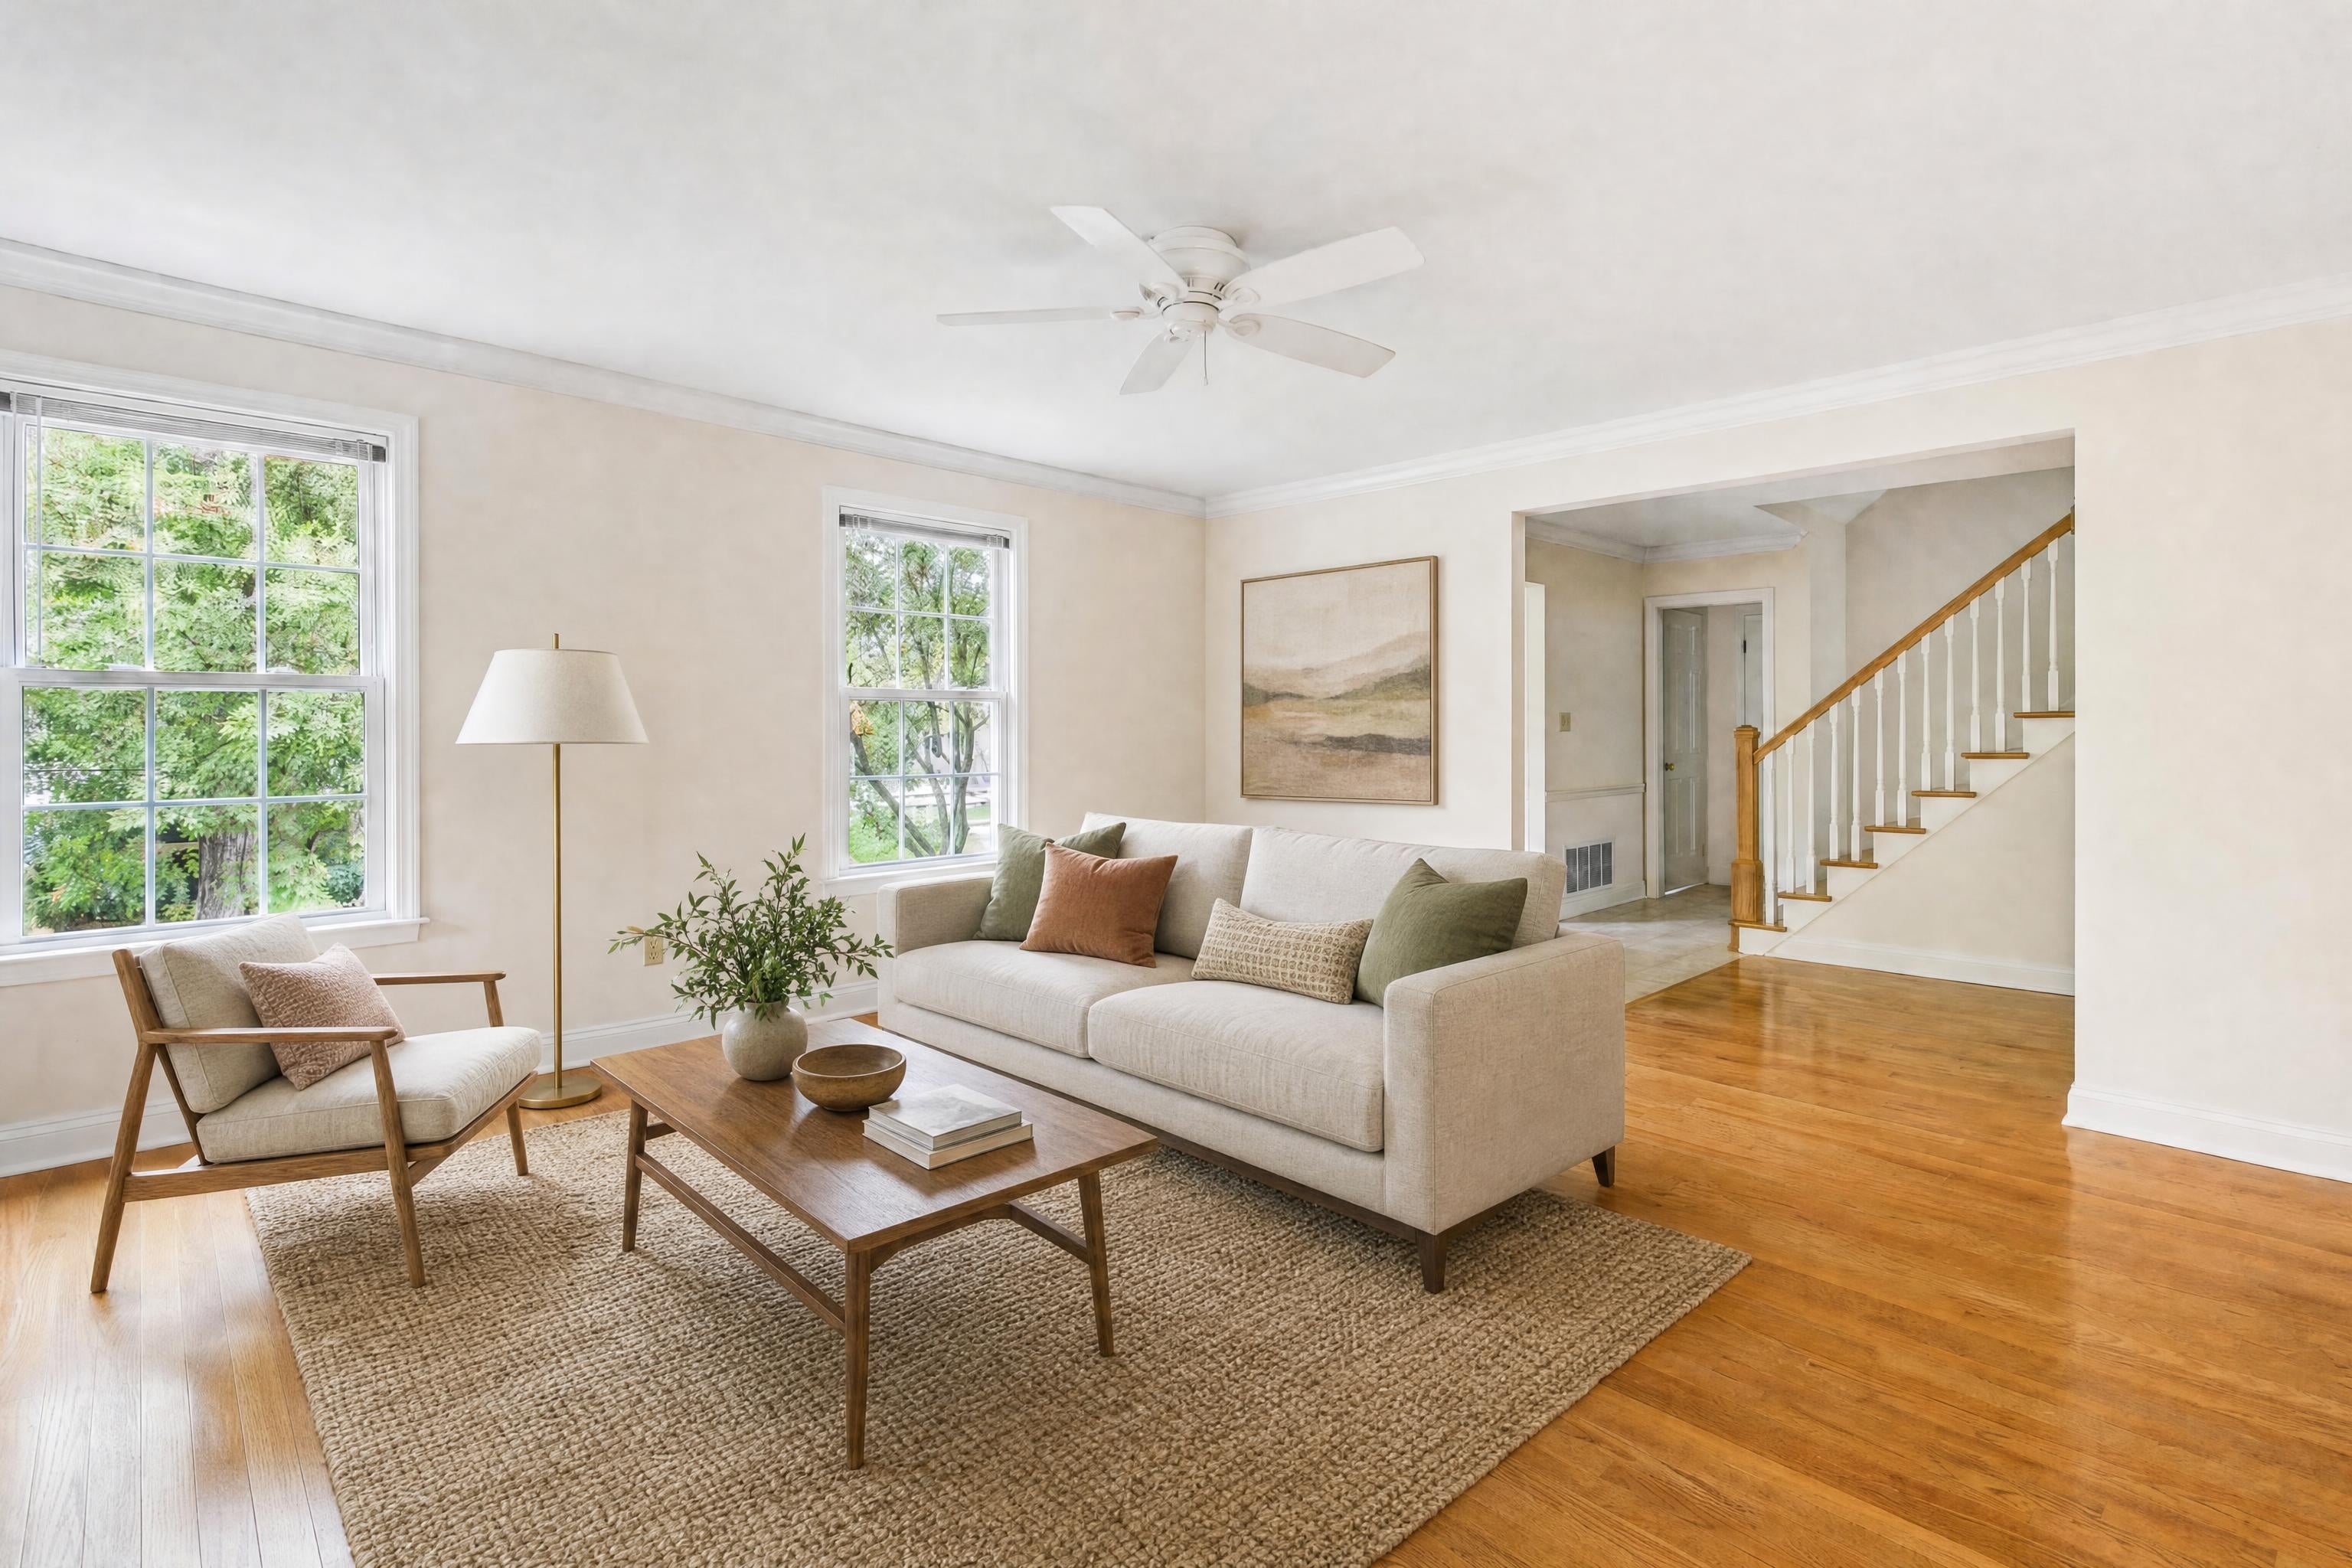
Stagingmate makes virtual staging for realtors simple: upload a photo, pick a style, and download an MLS-ready image in under a minute.

Stage a listing photo free
↔
BeforeAfter · Warm Modern
Cite this study

Stagingmate Research (2026). Searches for buyer agreements are up 105% since the NAR settlement. https://stagingmate.com/research/buyer-agent-commission-after-the-nar-settlement

Use our data

Free to use under CC BY 4.0 with a link to this page. For the full dataset or a local cut, email press@stagingmate.com.

About this study

Yes. Searches for buyer agreements are up 105% on pre-settlement levels, while commission searches spiked and then fell back.

Related studies