stagingmate
Research/Housing / personal finance desks

Buyer search peaks the week of Jul 9 in 25 states

Across 2022 to 2025, Google searches for homes for sale hit their yearly high in July in 39 of 50 states, most often the week of Jul 9. Nationally, demand is within 5% of its peak from the week of Jun 18, so a listing that goes live in mid-June catches the whole summer high.

50 states208 weeks2 buyer-intent queries
Stagingmate Research
Published 2026-10-09
Method

Each week is numbered by its start date and labeled with its 2025 calendar date. Per state and year, each week's share of the year's search; shares averaged over the 4 years and smoothed with a 3-week rolling average; the peak week is the highest. Each state was pulled twice and averaged because Google Trends samples its data.

Sources
Google Trends search interest, web search, weekly
Limits

Search interest measures buyer attention, not closed sales. Weekly Trends data at state level is noisy, which is why years are averaged and weeks smoothed; neighboring weeks are often close behind the peak. Google Trends is relative within each state, so states are compared on timing, not volume.

Key findings

01Buyer search peaks the week of Jul 9 in 25 of 50 states, and in July in 39.
02Nationally the peak is the week of Jul 9; search is within 5% of that level from the week of Jun 18.
03The quietest week nationally is the week of Dec 3, 54% below the peak.
044 states peak before May: Florida (week of Feb 12), Hawaii (week of Mar 12), Alaska (week of Apr 16) and Wyoming (week of Apr 23).
05The latest peak is in Rhode Island, the week of Jul 30.
25/50

states where buyer search peaks the week of Jul 9.

Jun 18

the week US buyer search first reaches 95% of its summer peak.

+54%

more US buyer search in the peak week than in the quietest (week of Dec 3).

The peak week for buyer search in every state

Week number of the year with the highest average share of buyer search, 2022–2025 (week 28 = early July). Hover or sort to see dates.

FL7
HI11
AK16
WY17
VT24
AL26
KS26
MS26
MT26
ND26
WV26
CT27
DE27
IA27
LA27
MI27
NE27
NY27
OR27
SC27
TN27
TX27
AZ28
AR28
CA28
CO28
GA28
ID28
IL28
IN28
KY28
MD28
MA28
MN28
MO28
NV28
NJ28
NM28
NC28
OH28
OK28
PA28
SD28
UT28
VA28
WA28
WI28
ME29
NH29
RI31
7
31

All 50 states

Click a column to sort
Rhode Island31Jul 30Jun 18Dec 354
Maine29Jul 16Jun 11Dec 1060
New Hampshire29Jul 16Jun 18Dec 1063
Arizona28Jul 9Jul 2Dec 344
Arkansas28Jul 9Jun 25Dec 351
California28Jul 9Jun 25Dec 350
Colorado28Jul 9Jul 2Dec 358
Georgia28Jul 9May 28Dec 351
Idaho28Jul 9Jun 25Dec 358
Illinois28Jul 9Jun 25Dec 356
Indiana28Jul 9Jun 4Dec 372
Kentucky28Jul 9May 21Dec 360
Maryland28Jul 9Jun 18Dec 1052
Massachusetts28Jul 9Jun 11Dec 364
Minnesota28Jul 9Jun 18Dec 370
Missouri28Jul 9May 28Dec 354
Nevada28Jul 9Jun 11Nov 2644
New Jersey28Jul 9Jun 25Dec 1057
New Mexico28Jul 9Jun 11Dec 340
North Carolina28Jul 9Jun 11Dec 355
Ohio28Jul 9May 28Dec 357
Oklahoma28Jul 9Jun 25Dec 349
Pennsylvania28Jul 9Jun 25Dec 359
South Dakota28Jul 9Apr 2Dec 359
Utah28Jul 9Jun 18Dec 359
Virginia28Jul 9Jun 25Dec 357
Washington28Jul 9Mar 26Dec 353
Wisconsin28Jul 9May 21Nov 2660
Connecticut27Jul 2Jun 11Dec 1055
Delaware27Jul 2Jun 18Dec 363
Iowa27Jul 2May 21Dec 365
Louisiana27Jul 2Apr 9Dec 350
Michigan27Jul 2Jun 18Dec 368
Nebraska27Jul 2Jun 18Dec 357
New York27Jul 2Jun 25Dec 1054
Oregon27Jul 2Mar 12Dec 351
South Carolina27Jul 2May 28Dec 356
Tennessee27Jul 2May 21Dec 353
Texas27Jul 2Jun 4Dec 352
Alabama26Jun 25May 21Nov 2655
Kansas26Jun 25May 28Dec 354
Mississippi26Jun 25May 14Nov 2649
Montana26Jun 25Apr 30Dec 361
North Dakota26Jun 25Apr 16Dec 1073
West Virginia26Jun 25Jun 11Nov 2657
Vermont24Jun 11May 21Dec 1066
Wyoming17Apr 23Mar 12Dec 1052
Alaska16Apr 16Mar 5Nov 1947
Hawaii11Mar 12Jan 8Nov 1931
Florida7Feb 12Jan 1Dec 1044

Summer, not spring, is the buyer peak

25/50

states where the single busiest week for buyer search is the week of Jul 9.

Average weekly share of the year's US buyer search, by month (2022–2025)

Jan
1.95%
Feb
2.02%
Mar
2.06%
Apr
2.02%
May
2.04%
Jun
2.13%
Jul
2.19%
Aug
2.03%
Sep
1.82%
Oct
1.69%
Nov
1.54%
Dec
1.55%
Source: Google Trends; Stagingmate analysisstagingmate

Searches build through the first half of the year, reach the plateau the week of Jun 18 and top out the week of Jul 9. A flat year would put every week at 1.92% of annual search.

The states on a different calendar

StatePeak week ofWithin 5% of peak fromQuietest week of
FloridaFeb 12Jan 1Dec 10
HawaiiMar 12Jan 8Nov 19
AlaskaApr 16Mar 5Nov 19
WyomingApr 23Mar 12Dec 10
VermontJun 11May 21Dec 10
AlabamaJun 25May 21Nov 26
KansasJun 25May 28Dec 3
MississippiJun 25May 14Nov 26
MontanaJun 25Apr 30Dec 3
North DakotaJun 25Apr 16Dec 10
West VirginiaJun 25Jun 11Nov 26
ConnecticutJul 2Jun 11Dec 10
DelawareJul 2Jun 18Dec 3
IowaJul 2May 21Dec 3
LouisianaJul 2Apr 9Dec 3
MichiganJul 2Jun 18Dec 3
NebraskaJul 2Jun 18Dec 3
New YorkJul 2Jun 25Dec 10
OregonJul 2Mar 12Dec 3
South CarolinaJul 2May 28Dec 3
TennesseeJul 2May 21Dec 3
TexasJul 2Jun 4Dec 3
MaineJul 16Jun 11Dec 10
New HampshireJul 16Jun 18Dec 10
Rhode IslandJul 30Jun 18Dec 3

What this means for agents

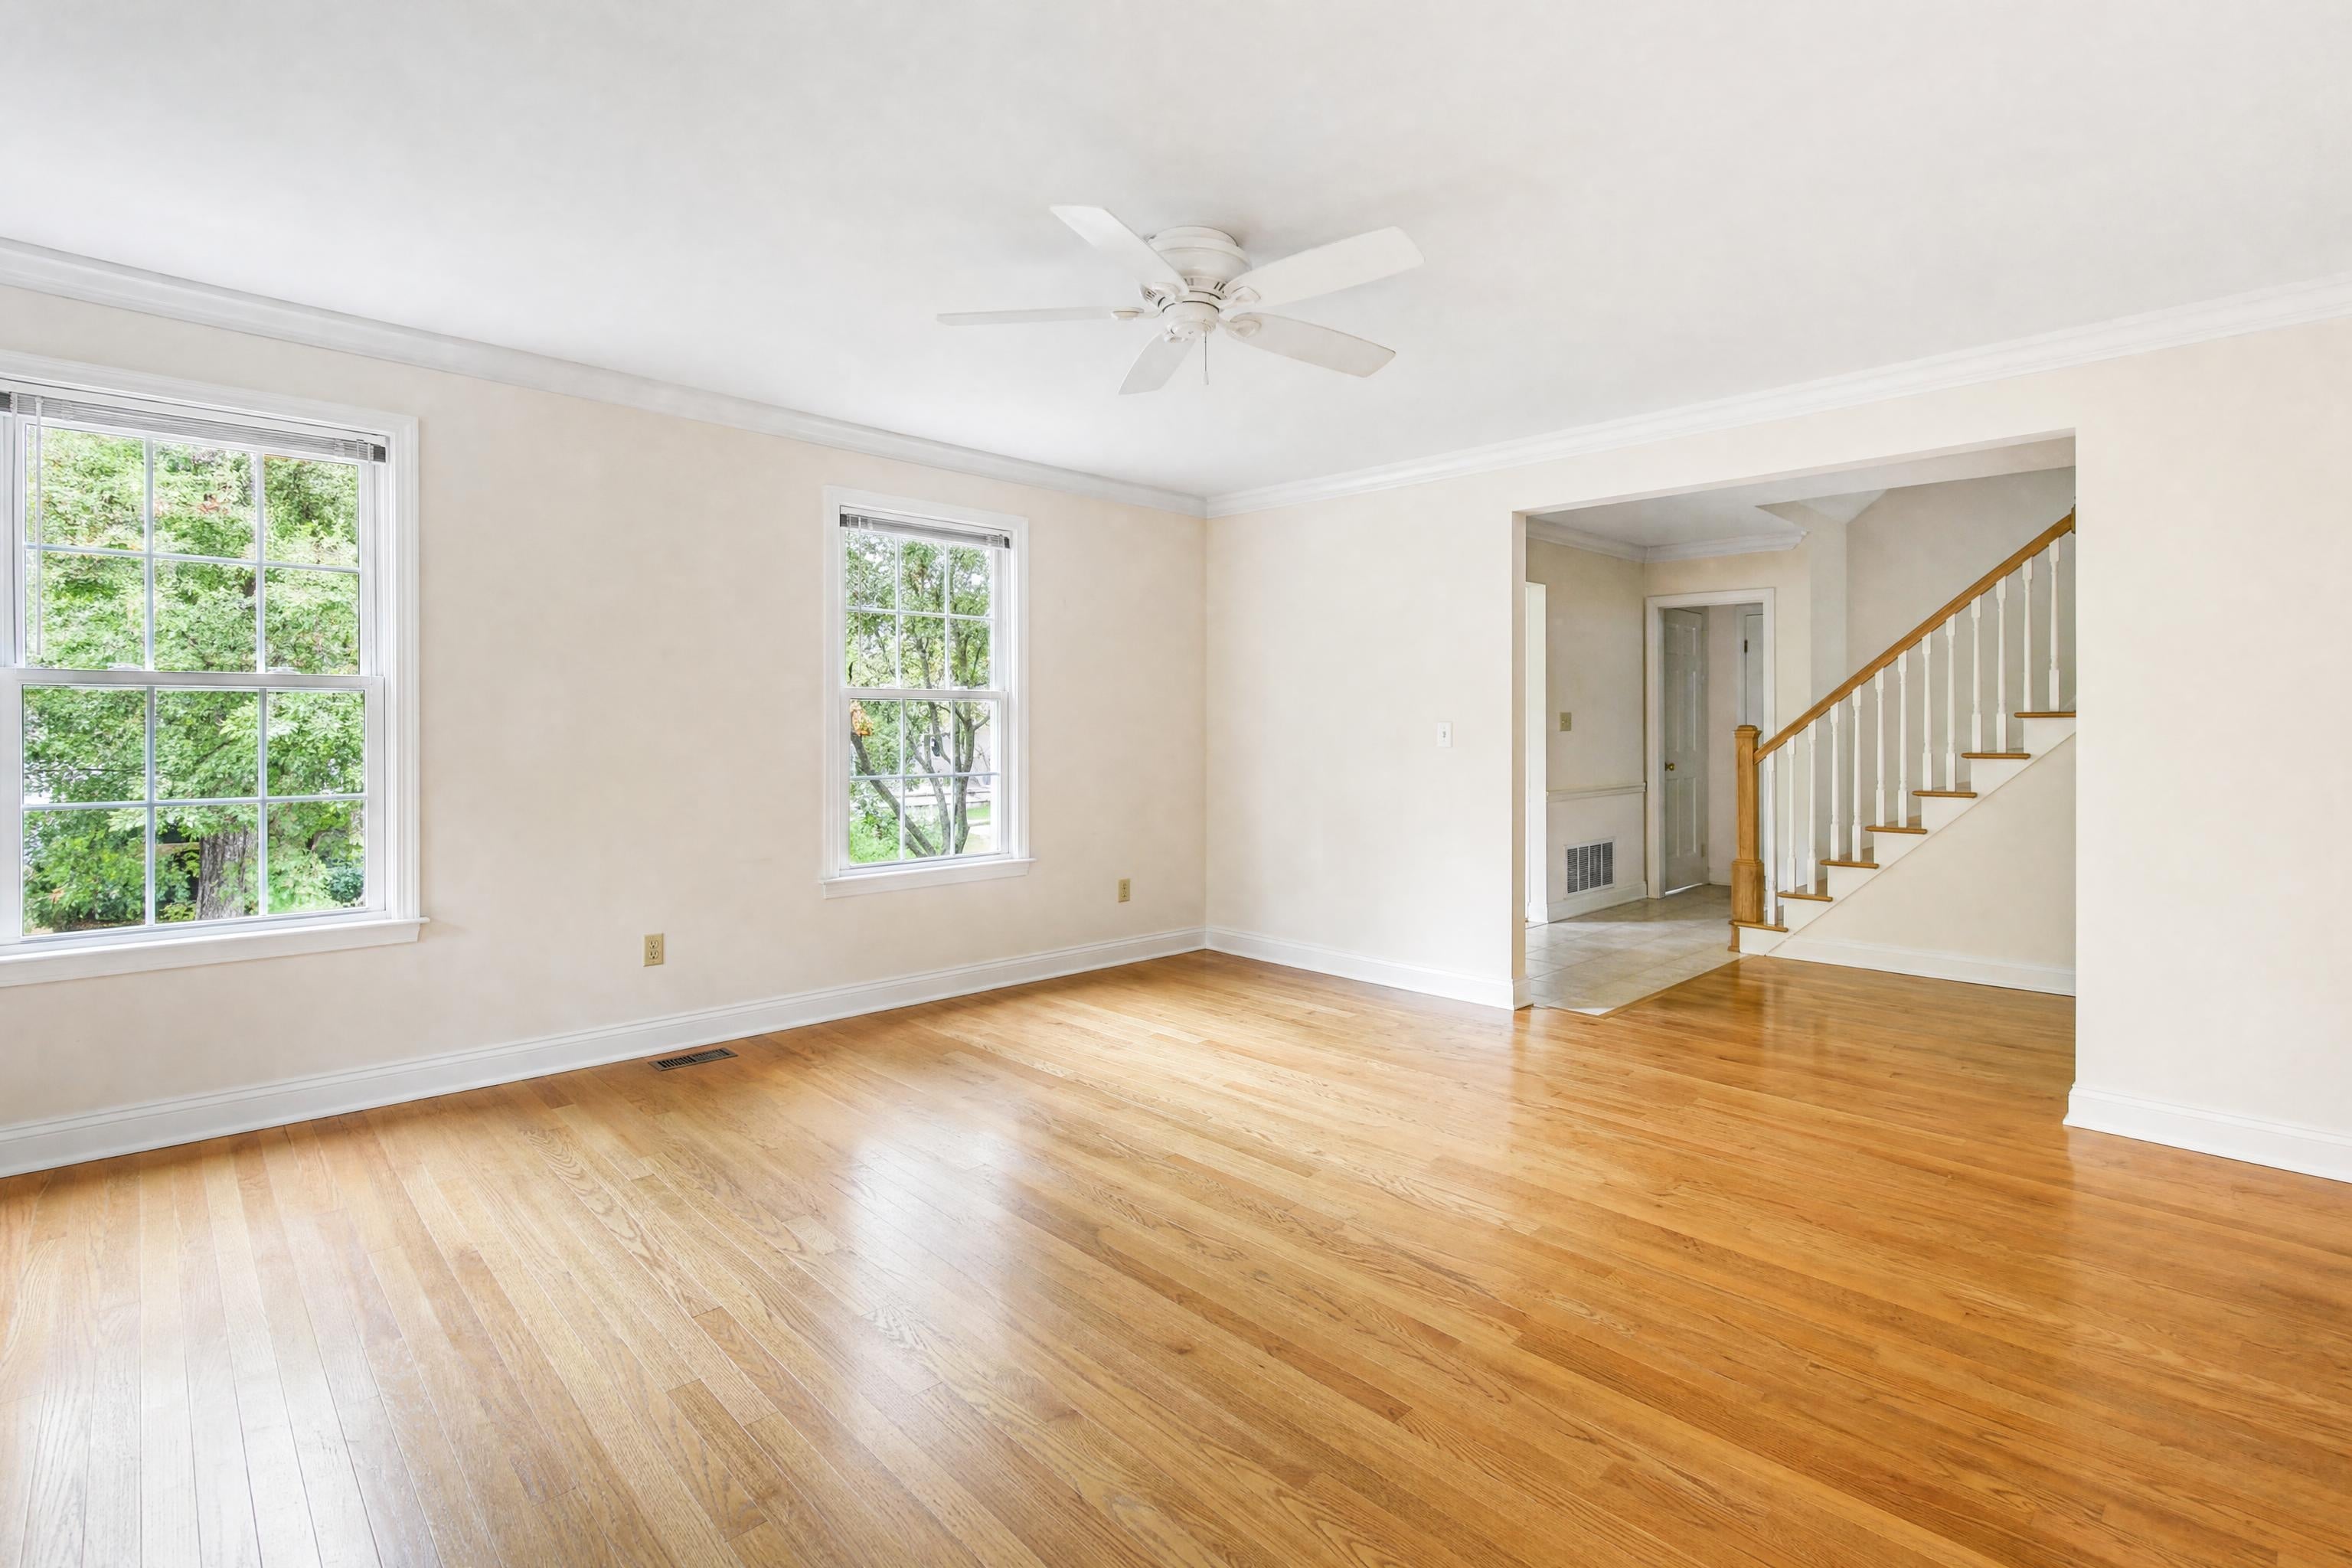
Stagingmate makes virtual staging for realtors simple: upload a photo, pick a style, and download an MLS-ready image in under a minute.

Stage a listing photo free
↔
BeforeAfter · Warm Modern
Cite this study

Stagingmate Research (2026). Buyer search peaks the week of Jul 9 in 25 states. https://stagingmate.com/research/the-best-week-to-list-a-house-in-every-us-metro

Use our data

Free to use under CC BY 4.0 with a link to this page. For the full dataset or a local cut, email press@stagingmate.com.

About this study

By buyer search, the peak is the week of Jul 9 in 25 of 50 states. Listing by the week of Jun 18 puts a home on the market for the whole summer high.

Related studies