stagingmate
Research/Housing desks

Washington, DC: homes sit 11% longer while buyer search fell 22%

We compared each large metro's days on market with how much its residents search for homes. In 63 of 81 metros, homes are sitting longer and buyer search is down. Washington, DC tops our stale-listing index.

81 metrosRealtor.com + search dataYear over year
Stagingmate Research
Published 2026-10-09
Method

Stale-listing index = % change in median days on market (Oct 2025–Sep 2026 vs the year before) minus % change in buyer searches (the median month of Sep 2025–Aug 2026 vs the median month of the year before, so one or two spike months don't drive the result). Higher means homes are sitting longer while fewer people are looking.

Sources
Realtor.com monthly listing inventory data (median days on market, listing prices, price cuts, active listings), October 2024 to September 2026Google monthly search volume for "homes for sale" and "houses for sale" in each metro area, September 2024 to August 2026
Limits

Realtor.com figures cover listings on Realtor.com and are medians for each month; a metro's median can move when the mix of homes listed changes. Google's metro search areas are broader than census metros. Google reports rounded monthly search volumes, and very small volumes show as 10 or nothing, so small states and rare queries are noisy. Google may group close variants of a query. Search volume measures interest, not transactions.

Key findings

01Homes are sitting longer and buyer search is down in 63 of 81 large metros.
02The highest stale-listing index: Washington, DC (days on market +11%, search −22%), Baltimore, MD (days on market +11%, search −18%) and Boston, MA (days on market +11%, search −18%).
03The lowest: Syracuse, NY (days on market −14%, search −4%), Rochester, NY (days on market −11%, search −9%) and New Orleans, LA (days on market −0%, search 0%).
04Across metros, bigger search declines go with bigger increases in days on market (correlation -0.23).
63/81

metros where days on market rose and buyer search fell.

+5%

median change in days on market, year over year.

−12%

median change in buyer search over the same year.

The stale-listing index

MetroDays on marketChangeBuyer search changeIndex
Washington, DC41+11%−22%32.8
Baltimore, MD42+11%−18%29.8
Boston, MA42+11%−18%29
Nashville, TN60+6%−22%28.6
Augusta, GA71+8%−20%27.9
Albuquerque, NM67+6%−22%27.7
Bakersfield, CA55+9%−17%26.5
Las Vegas, NV59+12%−14%26
Houston, TX54+6%−19%25.3
Charlotte, NC60+12%−13%25.2
Des Moines, IA65+3%−21%24.4
Toledo, OH45+16%−8%23.9
Greensboro, NC57+11%−12%23
Tampa, FL74+8%−15%22.9
Denver, CO54+4%−18%22.6
El Paso, TX71+8%−15%22.6
Chattanooga, TN63+7%−16%22.4
Dallas, TX58+5%−17%21.9
Dayton, OH46+10%−12%21.9
Greenville, SC59+9%−13%21.4
Columbia, SC51+7%−15%21.1
Columbus, OH47+9%−12%21
Raleigh, NC58+6%−14%20.4
Knoxville, TN63+9%−11%20.4
Miami, FL83+5%−15%20.3
Urban Honolulu, HI76+6%−14%20.2
Indianapolis, IN54+9%−11%20.1
Minneapolis, MN42+1%−18%19.7
Oklahoma City, OK56+10%−9%19.7
Louisville/Jefferson County, KY45+4%−16%19.5
Charleston, SC56+7%−13%19.5
Phoenix, AZ63+3%−16%19.4
Detroit, MI45+7%−13%19.1
Austin, TX71+9%−10%19.1
San Antonio, TX69+1%−18%18.9
Seattle, WA47+10%−8%18.3
Hartford, CT37+2%−17%18.2
Salt Lake City, UT56+3%−15%18.1
Colorado Springs, CO59+8%−10%18
St. Louis, MO49+5%−13%17.9
Jackson, MS74−2%−18%16.4
Orlando, FL76+6%−10%15.8
Madison, WI53+2%−14%15.6
Cincinnati, OH44+7%−9%15.5
Grand Rapids, MI45+5%−11%15.5
Tulsa, OK59+5%−10%15.3
Jacksonville, FL68−1%−16%15.1
Portland, OR64+4%−11%15
Milwaukee, WI38+11%−4%14.7
Memphis, TN68+6%−8%14.6
Philadelphia, PA47+3%−12%14.4
Little Rock, AR52+0%−14%14.3
Cleveland, OH47+2%−12%14
Sacramento, CA50+5%−9%13.7
Providence, RI41+7%−7%13.7
Albany, NY57+3%−11%13.3
San Diego, CA45+4%−9%13
Los Angeles, CA54+6%−6%12.2
Tucson, AZ60+5%−7%11.8
New York, NY56−2%−13%10.8
Baton Rouge, LA75−3%−14%10.8
Spokane, WA48+2%−8%10.2
Atlanta, GA58+5%−5%9.8
Boise City, ID47−1%−9%7.6
Omaha, NE43−3%−10%7.1
Birmingham, AL62+3%−4%6.9
Fresno, CA57+6%0%6
McAllen, TX78+6%0%5.9
Portland, ME53−1%−7%5.7
San Francisco, CA40−5%−11%5.6
Richmond, VA45−1%−6%5.3
Buffalo, NY47+2%−3%4.5
Scranton, PA53+2%−2%4.2
Chicago, IL40+0%−3%3.1
Pittsburgh, PA60+2%0%2.3
Harrisburg, PA42+2%0%1.6
Wichita, KS55+3%+2%1.2
Kansas City, MO52−7%−8%0.8
New Orleans, LA78−0%0%-0.1
Rochester, NY36−11%−9%-2.6
Syracuse, NY54−14%−4%-9.4

What this means for agents

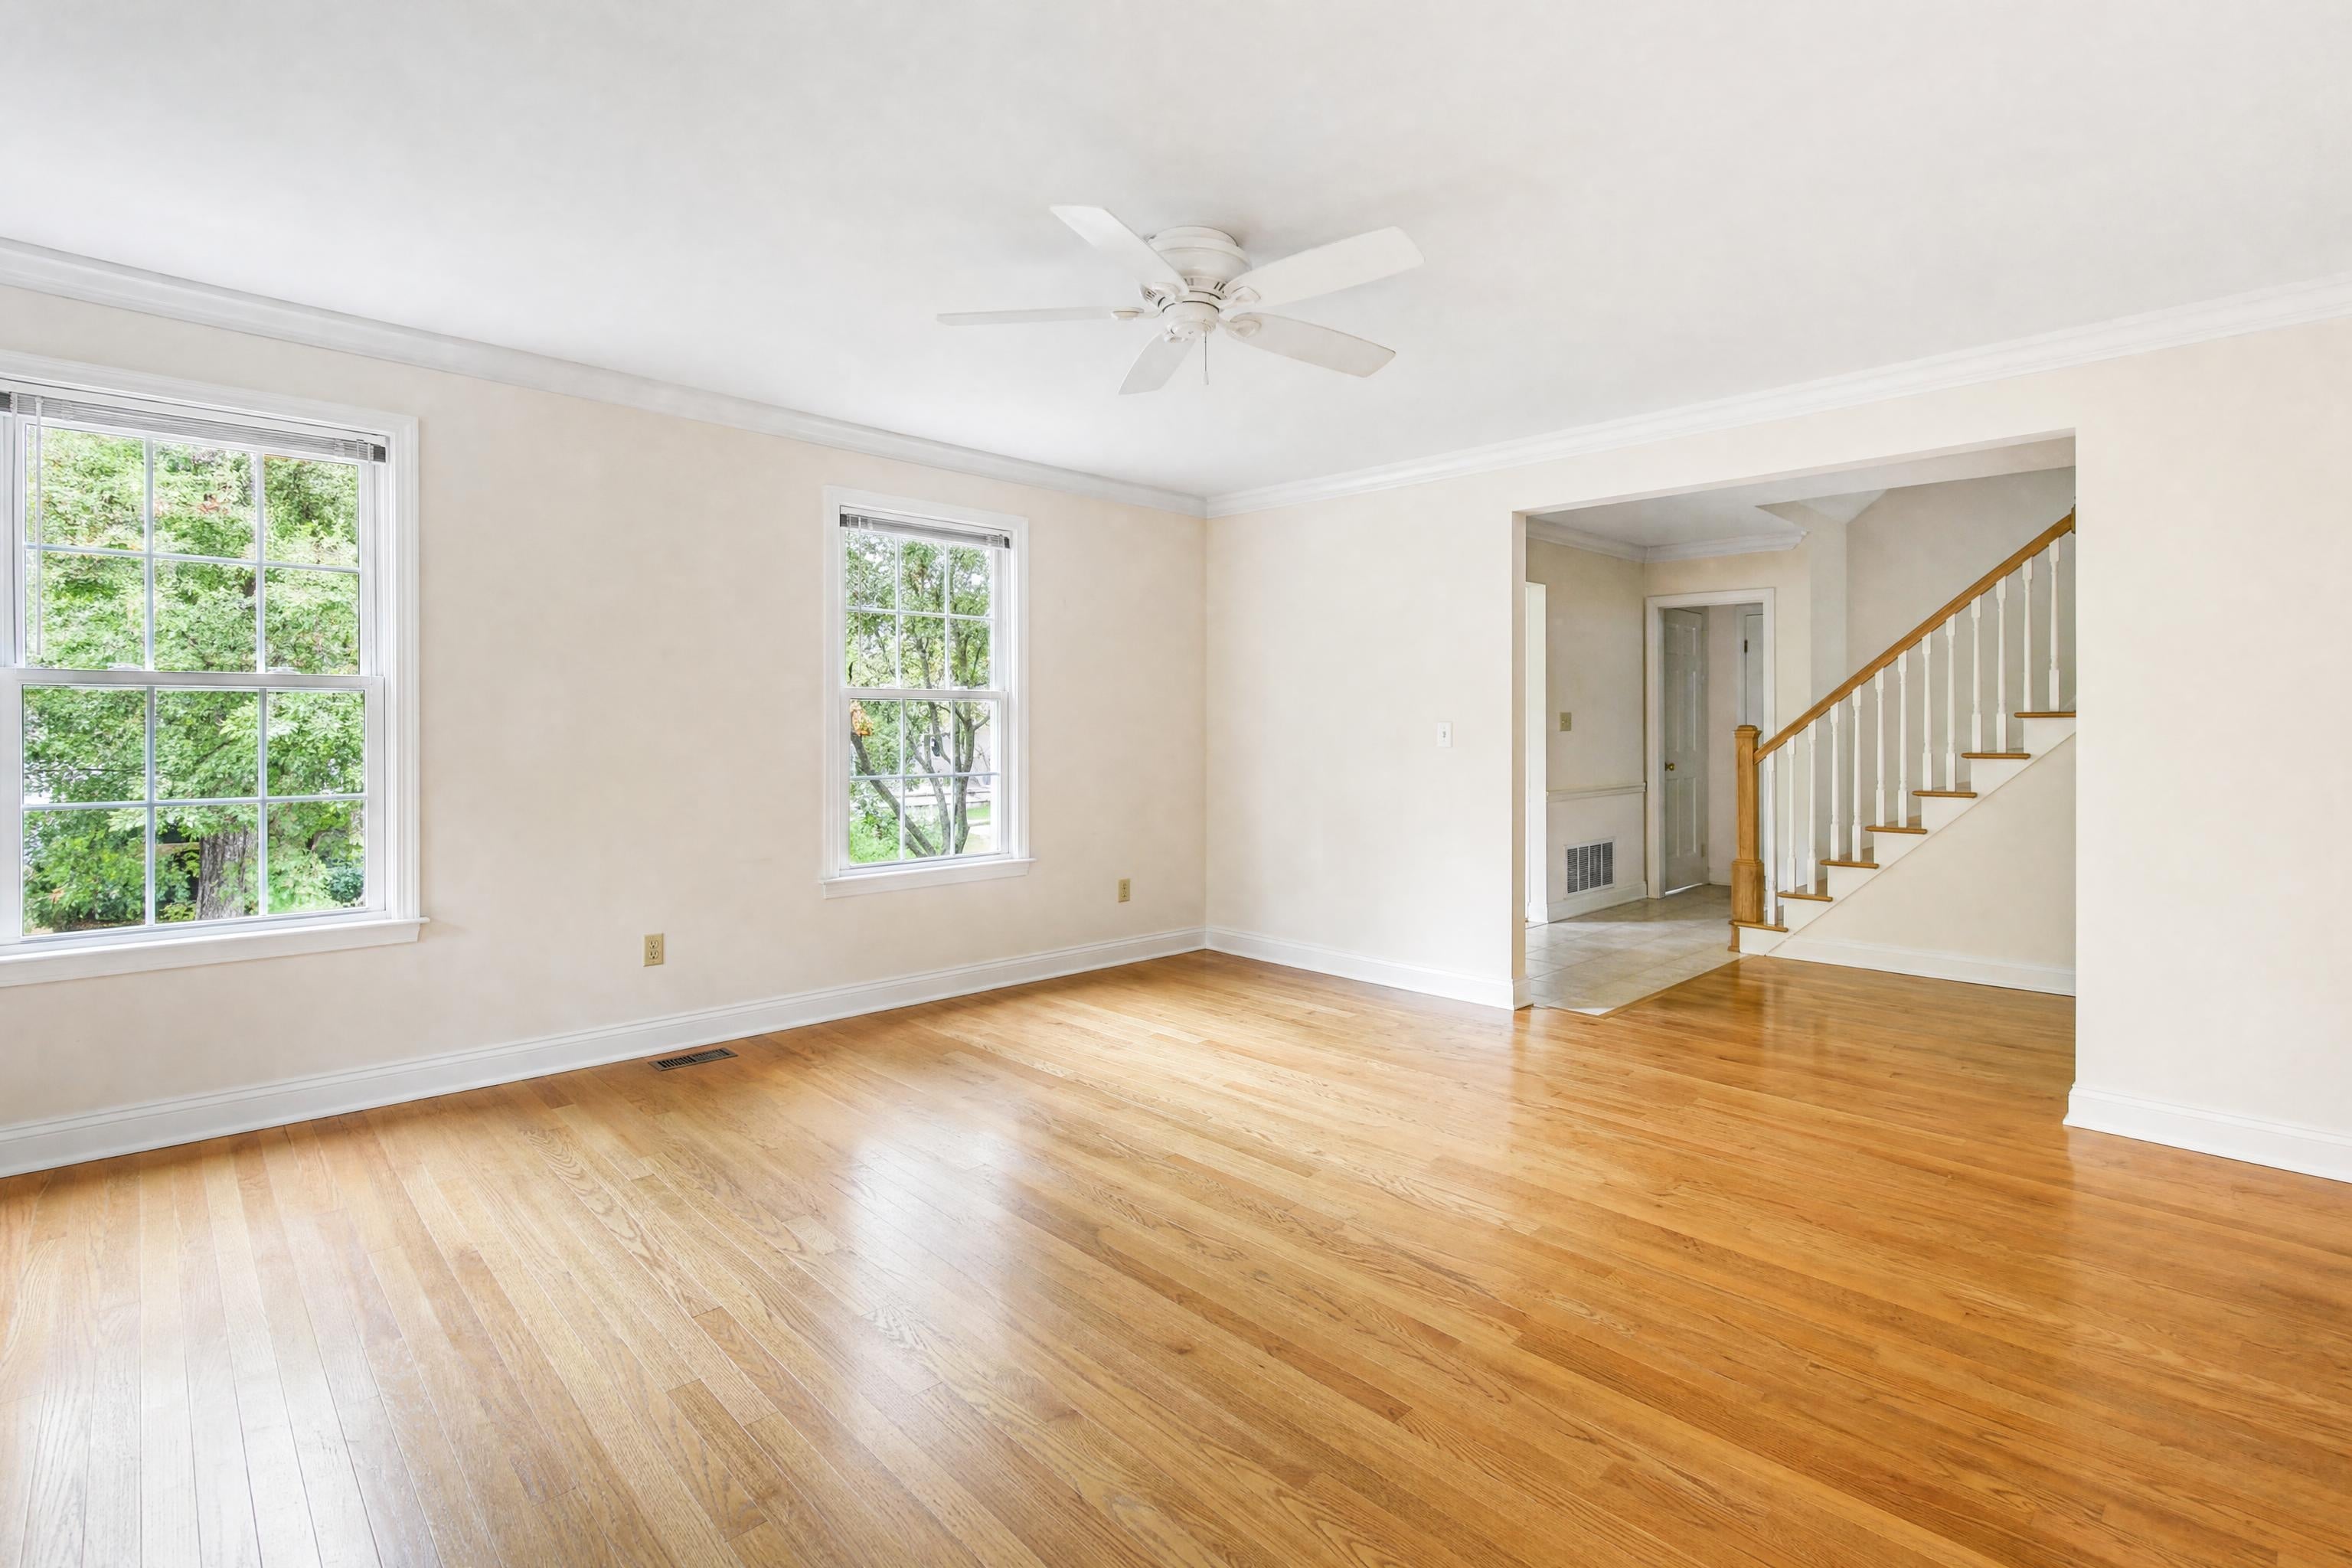
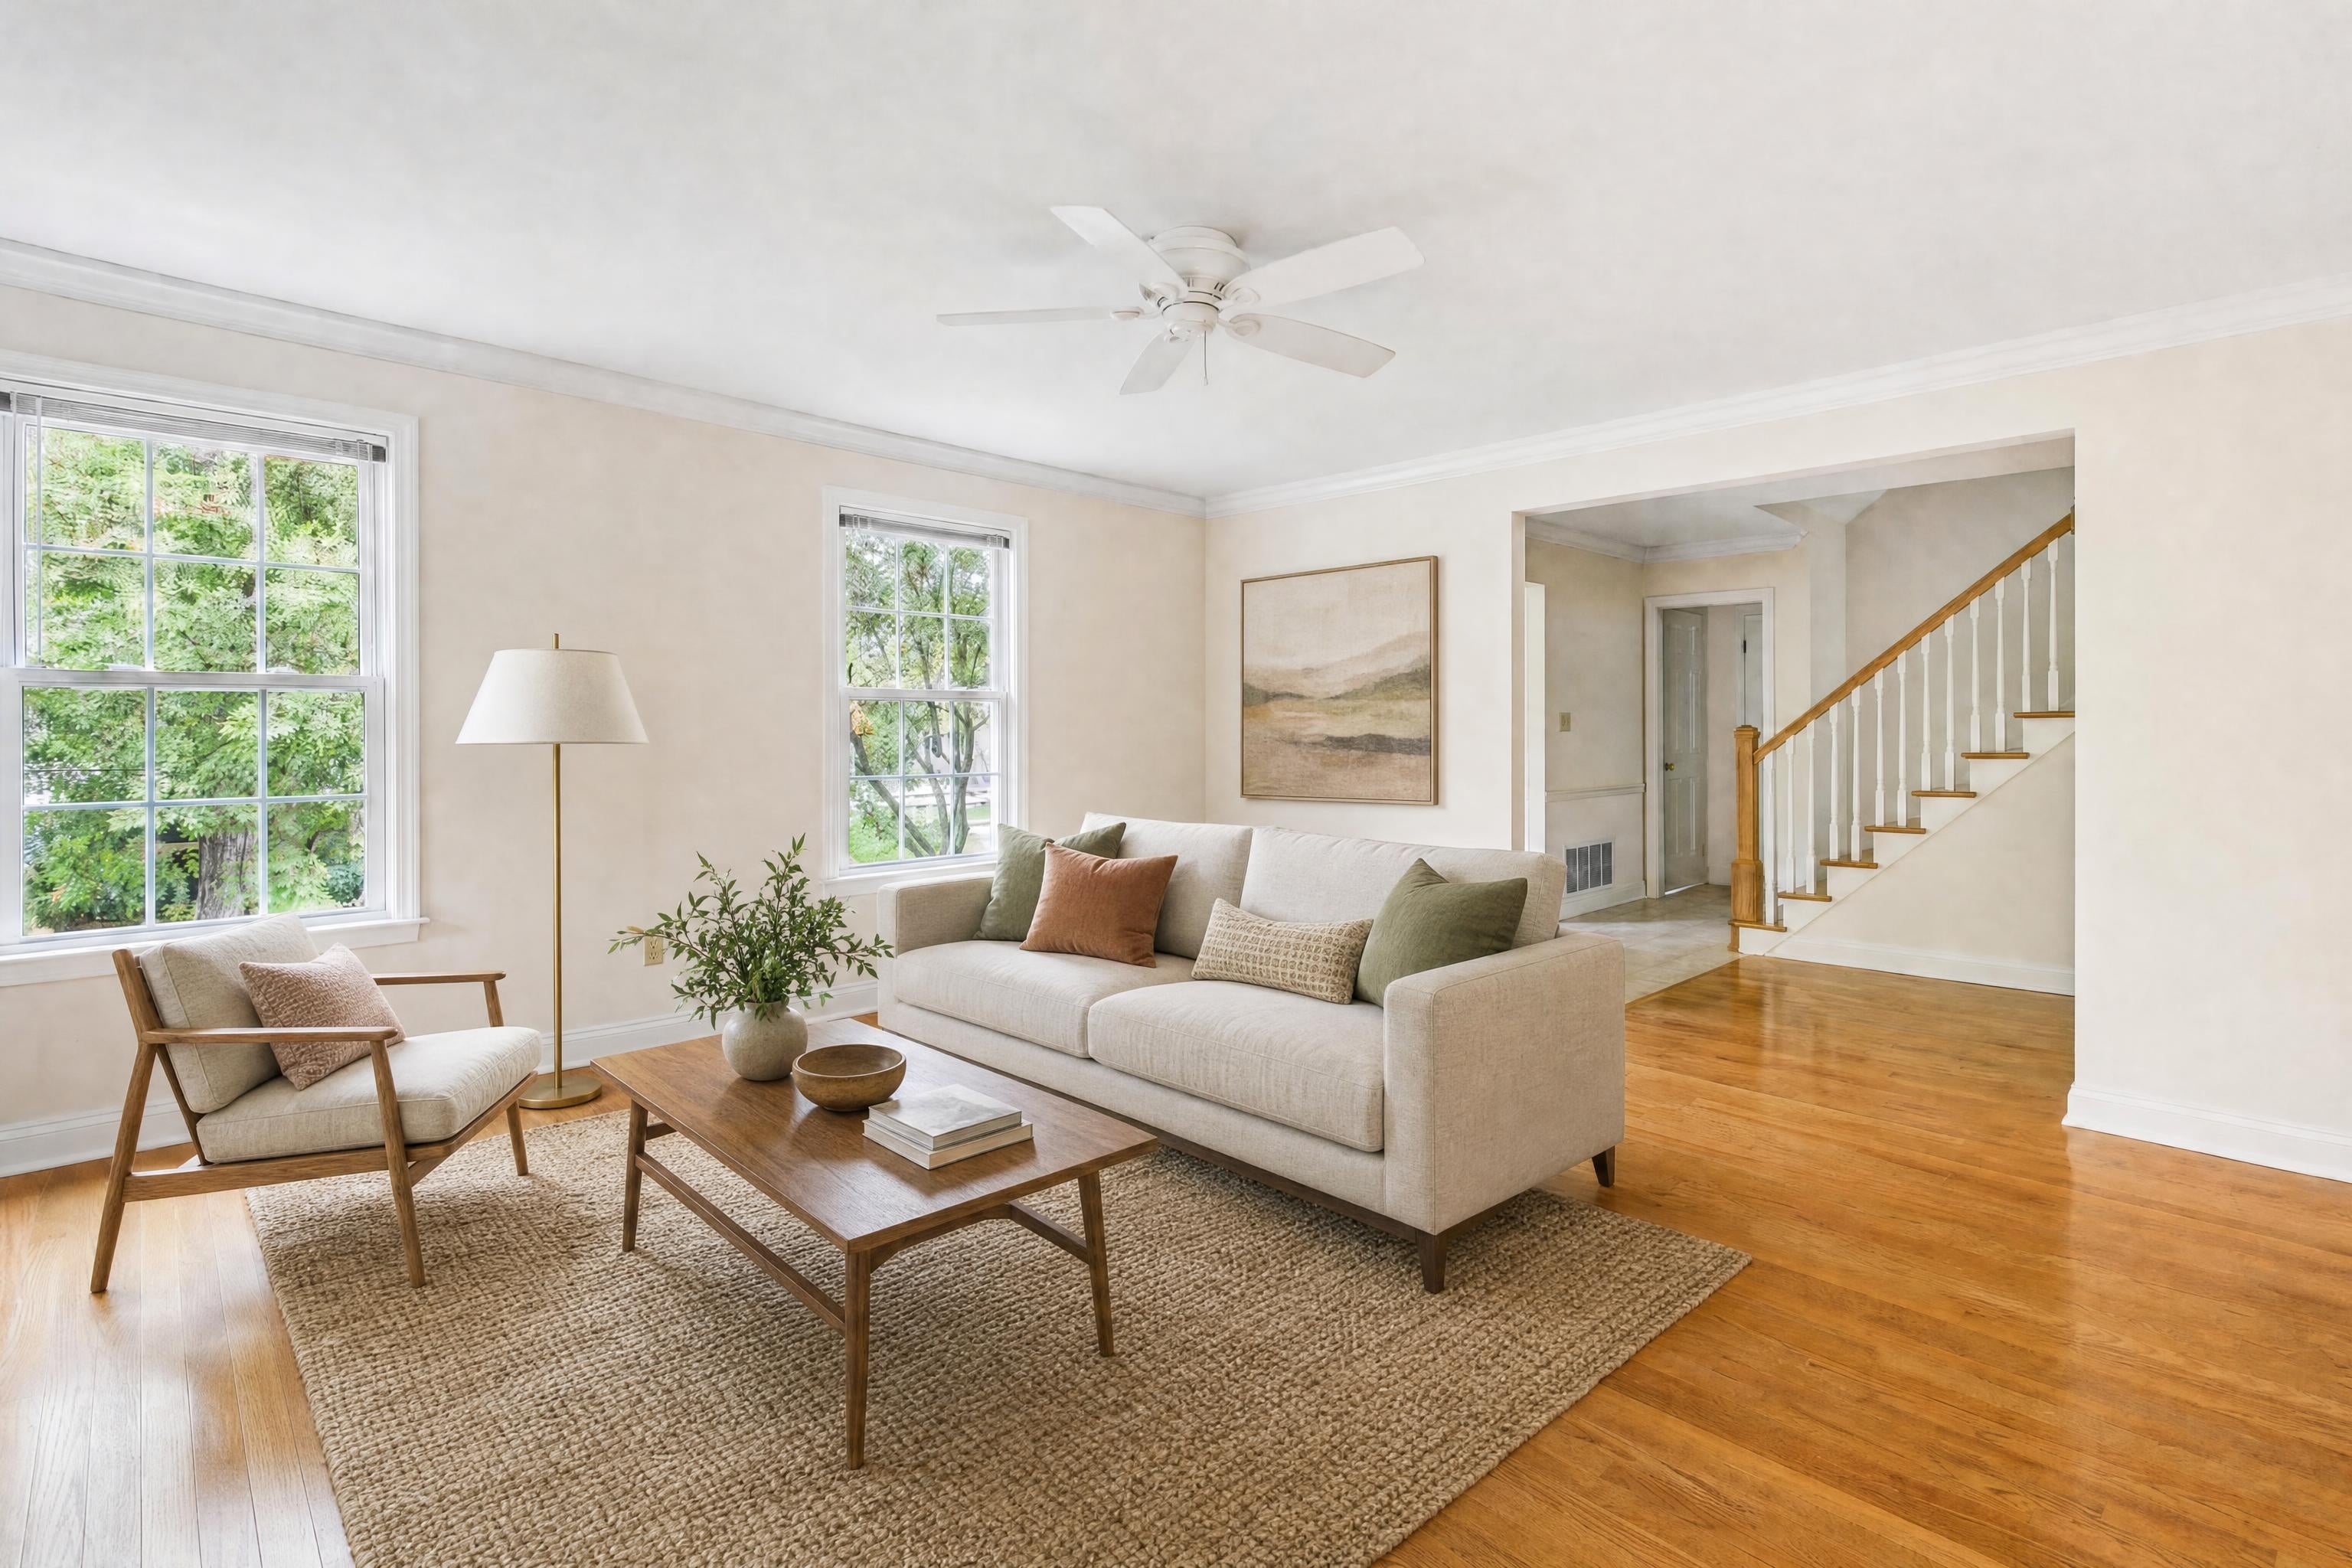
Stagingmate makes virtual staging simple: upload a photo, pick a style, and download an MLS-ready image in under a minute.

Stage a listing photo free
↔
BeforeAfter · Warm Modern
Cite this study

Stagingmate Research (2026). Washington, DC: homes sit 11% longer while buyer search fell 22%. https://stagingmate.com/research/days-on-market-vs-buyer-search-demand-by-metro

Use our data

Free to use under CC BY 4.0 with a link to this page. For the full dataset or a local cut, email press@stagingmate.com.

About this study

Washington, DC, Baltimore, MD and Boston, MA score highest on our index of rising days on market and falling buyer search.

Related studies