stagingmate
Research/Housing desks

Price cuts peak in September in 35 of the 100 largest metros

Price cuts don't wait for winter. In 35 of the 100 largest metros, the share of listings with a price reduction is highest in September, after the spring rush, and in 85 metros it peaks between July and October. Nationally, 18.2% of listings carried a price cut in a typical month over the past year.

100 metros36 monthsRealtor.com data
Stagingmate Research
Published 2026-10-09
Method

For each metro, the month of the year with the highest average share of listings with a price reduction over 36 months. Within each metro, the correlation between monthly median days on market and price-cut share, and the median days on market in the months when price cuts were in the top quarter vs bottom quarter. National share: state price-cut shares weighted by active listings.

Sources
Realtor.com monthly listing inventory data (median days on market, listing prices, price cuts, active listings), 100 largest metro areas and all states, October 2023 to September 2026
Limits

Realtor.com figures cover listings on Realtor.com and are medians for each month; a metro's median can move when the mix of homes listed changes. Realtor.com reports the share of listings with a price cut each month, not how long each home waited before its first cut, so the plan's "days before the first cut" is approached through timing and days-on-market patterns instead.

Key findings

01Price-cut share peaks in September in 35 of 100 metros; October in 19 and July in 18.
02In months when price cuts are most common, the median metro's homes had been on the market 51 days, vs 56 days when cuts were rarest: cuts follow the season, not days on market.
03Days on market and price-cut share move together in only 13 of 100 metros (median correlation -0.185).
0418.2% of US listings had a price cut in a typical month over the past year, vs 18.7% the year before.
05Most cuts: Phoenix, AZ (27.8%), Portland, OR (26.3%) and Colorado Springs, CO (25.7%). Fewest: Rochester, NY (4.4%), Syracuse, NY (6.0%) and Hartford, CT (8.3%).
35/100

metros where price cuts peak in September.

18.2%

of US listings had a price cut in a typical month, Oct 2025 to Sep 2026.

28%

of listings in Phoenix, AZ had a price cut, the most of any large metro.

When sellers cut

September

is the peak month for price cuts in 35 of the 100 largest metros.

Metros by peak month for price cuts (Oct 2023 to Sep 2026)

March
6
June
7
July
18
August
13
September
35
October
19
November
2
Source: Realtor.com; Stagingmate analysisstagingmate

Sellers list in spring at hopeful prices. By late summer, the homes that haven't sold get cut, just as buyer search starts to fade.

Where price cuts are most common

MetroListings with a price cutMedian days on marketPeak cut month
Phoenix, AZ27.8%63June
Portland, OR26.3%64August
Colorado Springs, CO25.7%59August
Denver, CO25.5%54July
Tampa, FL25.0%74June
San Antonio, TX24.6%69August
Salt Lake City, UT24.6%56September
Austin, TX24.1%71July
Indianapolis, IN24.0%54October
Charleston, SC24.0%56July

What this means for agents

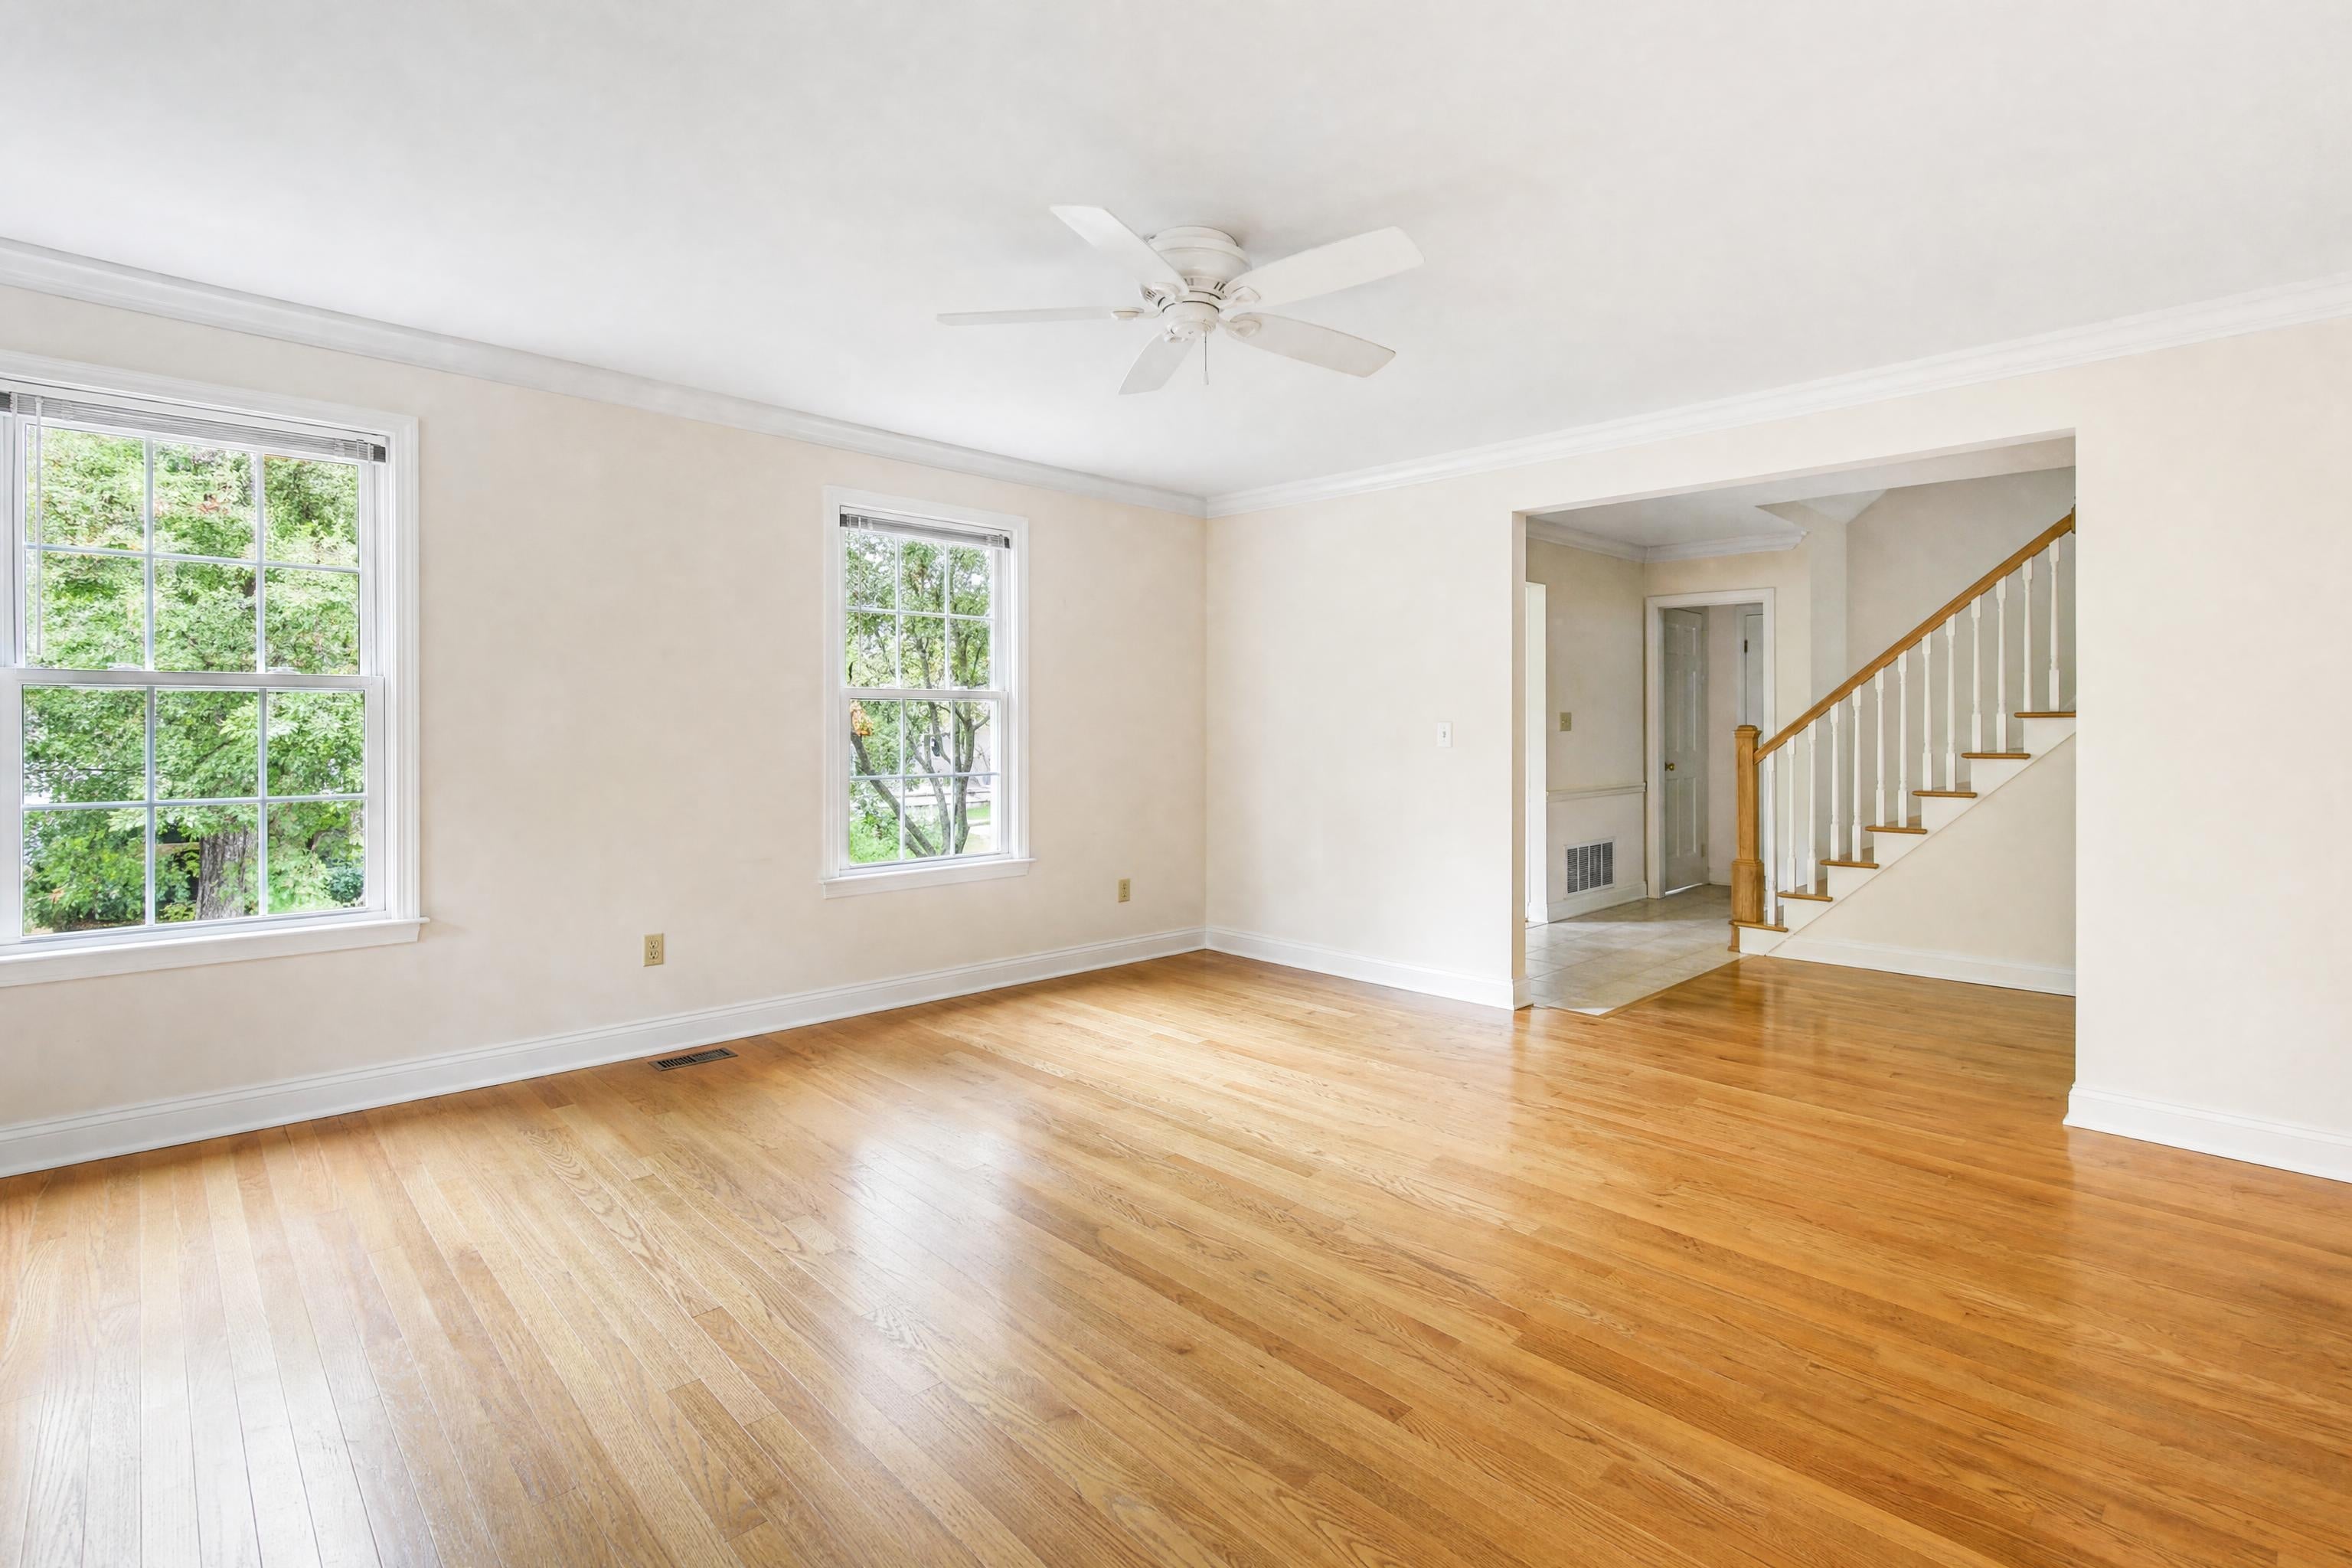
Stagingmate makes virtual staging for realtors simple: upload a photo, pick a style, and download an MLS-ready image in under a minute.

Stage a listing photo free
↔
BeforeAfter · Warm Modern
Cite this study

Stagingmate Research (2026). Price cuts peak in September in 35 of the 100 largest metros. https://stagingmate.com/research/how-long-houses-sit-before-the-first-price-cut

Use our data

Free to use under CC BY 4.0 with a link to this page. For the full dataset or a local cut, email press@stagingmate.com.

About this study

Most often in September: it is the peak month for price cuts in 35 of the 100 largest metros.

Related studies